

As apparently is my new annual tradition, I again in the lull between parent-teacher conferences reviewed and analyzed our CAT4 results. [I strongly encourage you to reread (or read for the first time) our philosophy on test-taking and how we both share the tests with parents and utilize the data in our decision-making.] We provided our teachers with the data they need to better understand their students and to identify which test results fully resemble their children well enough to simply pass on and which results require contextualization in private conversation. Those contextualizing conversations took place during conferences and, thus, we should be able to return all results to parents next week.
Before we get to the results, there are a few things worth pointing out:
- This is now our second year taking this assessment at this time of year. However, we expanded our testing from last year’s Grades 3, 6 & 8 to this year’s Grades 3 – 8. This means that although we now have “apples to apples” data, we can only track two of our grades (current Grades 4 & 7) from last year to this one. Next year, we will have such tracking data across most grades which will allow us to see if…
- The same grade scores as well or better each year.
- The same class grows at least a year’s worth of growth.
- The other issue is in the proper understanding of what a “grade equivalent score” really is.
Grade-equivalent scores attempt to show at what grade level and month your child is functioning. However, grade-equivalent scores are not able to show this. Let me use an example to illustrate this. In reading comprehension, your son in Grade 5 scored a 7.3 grade equivalent on his Grade 5 test. The 7 represents the grade level while the 3 represents the month. 7.3 would represent the seventh grade, third month, which is December. The reason it is the third month is because September is zero, October is one, etc. It is not true though that your son is functioning at the seventh grade level since he was never tested on seventh grade material. He was only tested on fifth grade material. He performed like a seventh grader on fifth grade material. That’s why the grade-equivalent scores should not be used to decide at what grade level a student is functioning.
We do not believe that standardized test scores represent the only, nor surely the best, evidence for academic success. Our goal continues to be providing each student with a “floor, but no ceiling” representing each student’s maximum success. Our best outcome is still producing students who become lifelong learners.
But I also don’t want to undersell the objective evidence that shows that the work we are doing here does in fact lead to tangible success!
That’s the headline…let’s look more closely at the story. (You may wish to zoom in a bit on whatever device you are reading this on…)
A few tips on how to read this:
- We took this exam in the “.2” of each grade-level year. That means that “at grade level” [again, please refer above to a more precise definition of “grade equivalent scores”] for any grade we are looking at would be 3.2, 4.2, 5.2, etc. For example, if you are looking at Grade 6, anything below 6.2 would constitute “below grade level” and anything above 6.2 would constitute “above grade level.”
- The maximum score for any grade is “.9” of the next year’s grade. If, for example, you are looking at Grade 8 and see a score of 9.9, on our forms it actually reads “9.9+” – the maximum score that can be recorded.
- Because of when we take this test – approximately two months into the school year – it is reasonable to assume a significant responsibility for results is attributable to the prior year’s teachers and experiences. It is very hard to tease it out exactly, of course.
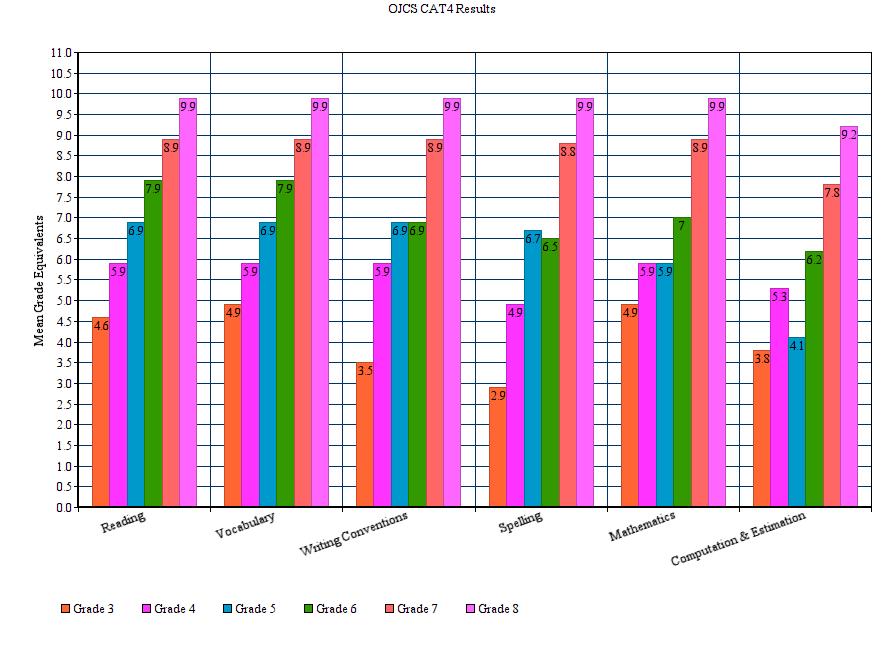
What are the key takeaways from this snapshot of the entire school?
- Looking at six different grades through six different dimensions there are only two instances of scoring below grade-level: Grade 3 in Spelling (2.9) and Grade 5 in Computation & Estimation (4.1).
- Relatedly, those two dimensions – Spelling and Computation & Estimation – are where we score the lowest as a school (even if every other grade is at or above grade level) relative to the other dimensions.
- What stands out the most is how exceedingly well each and every grade has done in just about each and every section. In almost all cases, each and every grade is performing significantly above grade-level.
In addition to the overall snapshot, we are now able to begin sharing comparative data. It will take one more year before we can accurately compare the same grade and the same class year after year. But we can get a taste of it with Grades 3 & 6. What you have below is a snapshot of the same class (the same group of children) from last year to this:
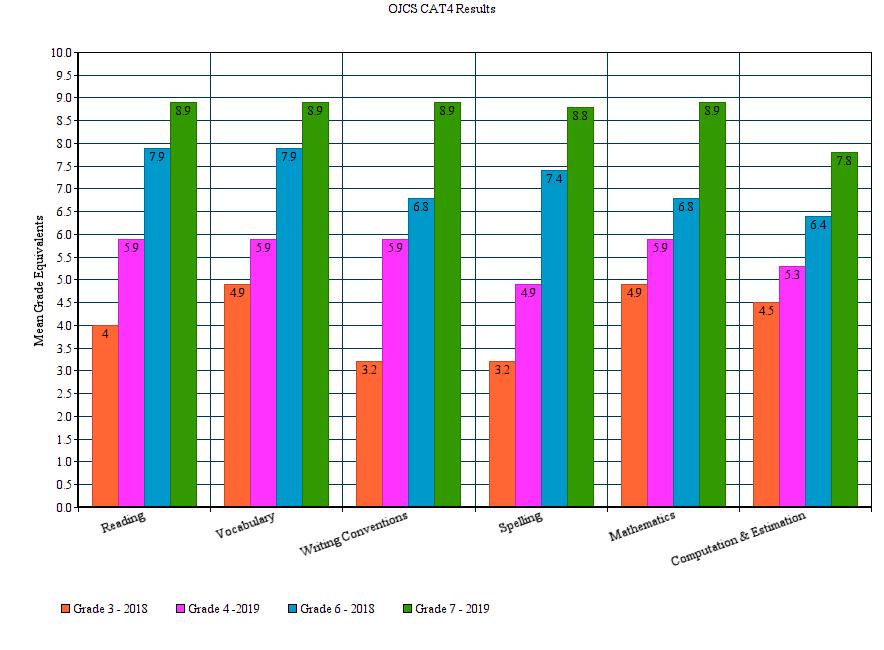
What are the key takeaways from this comparison?
For both classes in all categories save one (Grade 3 to 4 “Computation & Estimation”) you see at least a full year’s growth and in many cases you see more than a full year’s growth. (The one that fell short only showed 8 months of growth. And it comes in the category we have already recognized as being a weak spot.)
Let’s look at one more data point. We can also get a taste of how the same grade performs from one year to the next as well. Again, we only have Grades 3 & 6 to examine:
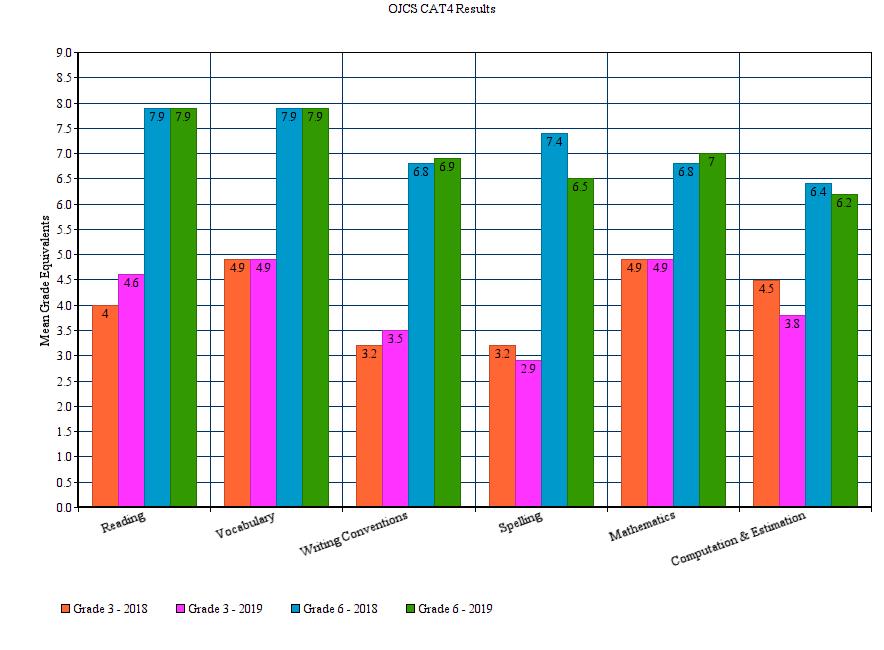
Now, remember that this represents a completely different group of children, so it is not unusual or surprising to see variances. Teachers can only grow students from the place they received them and it is that annual growth that we are concerned with. But over time you are looking for patterns. If we believe that Spelling is a weakness, we will want to know whether it is a weakness in every grade or does it dip in certain grades. We have no way to know that or much else new from the above graph. It simply confirms what we presently know. But in another year or so, we will be able to plot the trajectory of both classes (the same students) and grades over time to see what additional stories they tell.

To sum up, we have a lot to be proud of in our standardized test scores. We have two areas to investigate: Spelling and Computation. With regard to Spelling, since we noted this as a weakness last year we had already scheduled PD for our faculty. It just so happens that we are holding a session on “Structured Word Inquiry” for our Language Arts Teachers on Monday! With that and other efforts we would expect to see those numbers tick up next year. With regard to Computation, we will – like with Spelling – have an internal conversation which may lead to PD for Math Teachers. These are examples of how we use data to increase performance.
The bottom line is that our graduates successfully place into the high school programs of their choice. Each one had a different ceiling – they are all different – but working with them, their families and their teachers, we successfully transitioned them all to the schools (private and public) and programs (IB, Gifted, French Immersion, Arts, etc.) that they qualified for.
And now each year, despite all the qualifications and caveats, our CAT4 scores continue to demonstrate excellence. Excellence within the grades and between them. And let’s be clear, this academic excellence comes with an inclusive admissions process.
Despite our focus on individual growth, our average growth continues to significantly outpace national percentiles and grade equivalency scores. Does investing in reflective practices (like blogging) lead to achievement ? Does being an innovative learning pioneer translate into high academic success?
Two years in a row may not be conclusive, but it may be heading towards it!
Excellent and very informative Blog post for us parents. Thank you.
Thank you for posting these results and helping to interpret them. I appreciate the transparency.
The findings related to the current 5th grade’s math difficulties is borne by my personal experiences supporting my child in this subject and in speaking with other parents in the grade last year and this year.
Given that it is the starkest anomaly in these findings, would you consider directing additional math-instruction resources to the 5th-grade class to help them catch up and eliminate this gap? (This is by no means a comment on the performance of the current 5th-grade math teacher who, by all accounts and evidence, is doing wonderful work). It seems the students might benefit from additional support to help them get to where they need to be for their grade level.
Thanks again for this information.
Thanks for the feedback! As indicated in the blog post, the very next step in trying to understand the data is to bring together our teachers in mathematics for discussion and research. It COULD be the case that what the CAT4 is testing us on is actually not something we think is a priority. It COULD be the case that WHEN the CAT4 is asking our students these questions is not when we teach it and, thus, it is a timing issue, not a curriculum gap. It COULD be that our current curriculum isn’t the right one or that our current SUPPLEMENTARY curriculum isn’t the right one. It could be a lot of things. Armed with data, we know what kinds of questions to ask and based on those answers, we’ll know what should happen from there. For a grade, a class or the school as a whole. Once we have more to share on this, we will. But this is exactly why we do it and why we share it.