
I took advantage of the holiday weekend (Victoria Day, my American friends) with little opportunity to do much other than enjoy the weather at great (social) distance, to go through the results of this year’s Annual Parent Survey. If you would like to see a full comparison with last year, you can reread those results or have them open so you can toggle back and forth. In this post, I will try to capture the highlights and identify what trends as seem worth paying attention to.
The first thing to name, which does not come as a tremendous surprise considering the times we are living through, is that both the number and percentage of students captured in this year’s survey is markedly down from the prior two years. We have gone from 81 students to 84 students to 54 students. This represents about 32% of our student population. (Even less where not each survey is fully filled out.) As the survey is per student, not per family, it runs the risk of being even less representative than that. (In the service of anonymity, we have no way to actually know how many families the survey actually represents.) Last year, we were at about 40% of students represented with a goal this year of hitting 50%.
Of course, this is definitely not an “all things being equal” circumstance. We are still navigating distance learning and it is doubtful that drawing any meaningful conclusions about participation rates is worthwhile. [We saw a similar decline in percentage in this year’s Annual Faculty Survey and it aligns with fieldwide data.] Whereas it is common wisdom that folks with concerns are usually more likely to fill out these surveys, there is no common wisdom when it comes to pandemic times. So instead of worrying this year about the motivations for why families did or didn’t fill out surveys, let’s celebrate the parents who did participate and try to make meaning of what they are telling us.
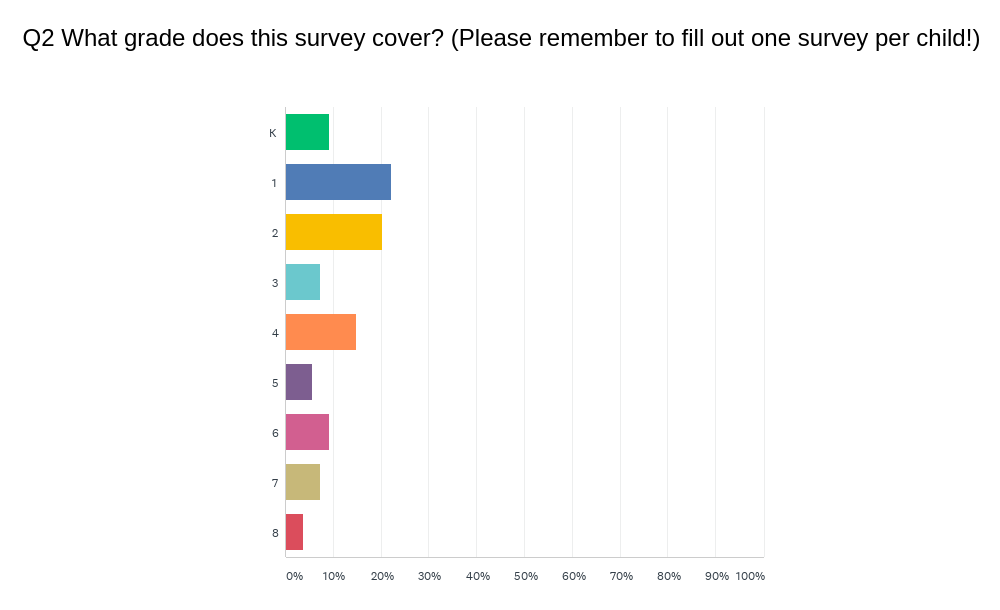
As was the case last year – and is usually the case everywhere – it is the parents of our youngest students who are the most invested with decreasing participation as the years go on. This year, we see less Kindergarten than normal, for what that’s worth.
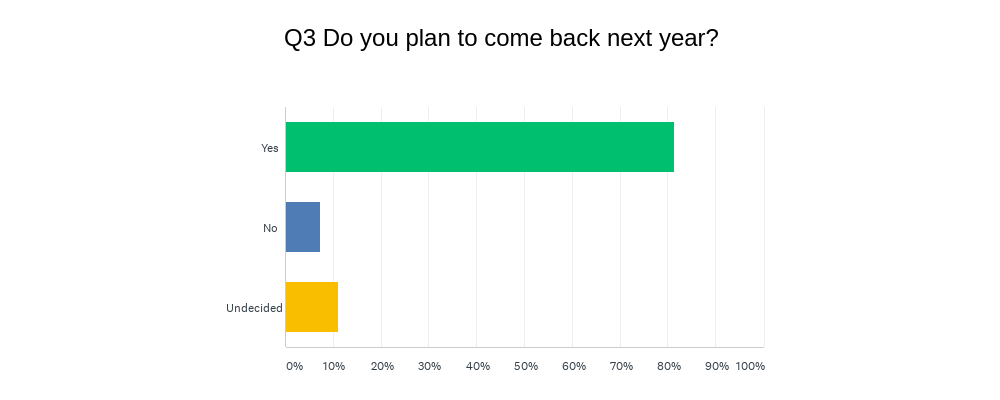
The percentage who replied “yes” is largely unchanged from last year (and always compounded by not knowing who of the “no’s” represent graduations or relocations, as opposed to choosing to attrit prior to Grade 8). What is different this year is that the percentage of “undecideds” is larger than the “no’s” for the first time. An increase of uncertainty certainly seems reasonable during a time of pandemic, although we have no way to tell the difference between correlation and causation. What continues to be true is that the overwhelming majority of families – regardless of their feedback – stay with us year after year. This continues to say a lot about them and a lot about us.
Let’s look at the BIG PICTURE:
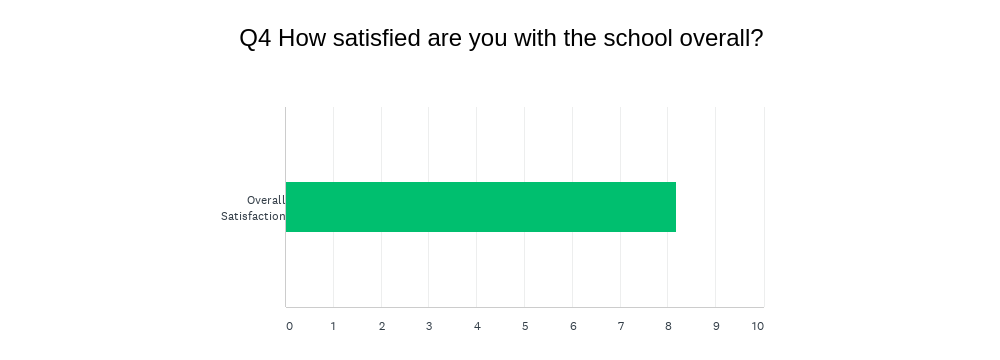
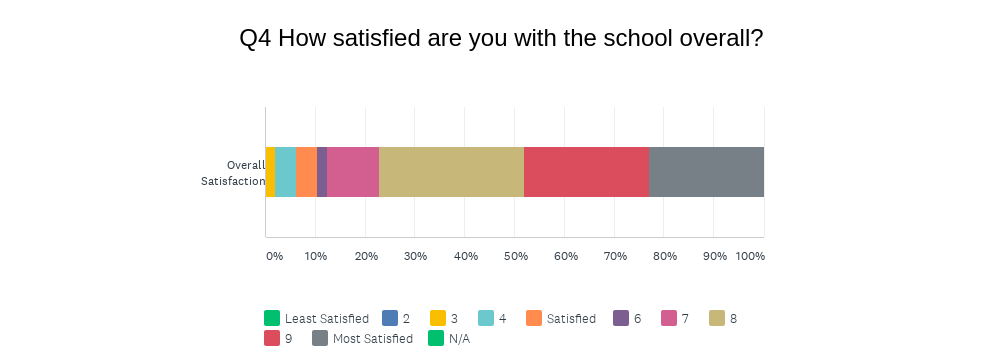
The first chart gives you the weighted average satisfaction score (out of 10); the second chart gives you the breakdown by category. I will remind you that for this and all categories, I look at the range between 7-9 as the healthy band, obviously wanting scores to be closer to 9 than to 7, and looking for scores to go up each year. In terms of “overall satisfaction”, we have now gone from 7.13 to 7.20 to 8.17. This year marks a meaningful jump in the right direction and you can see by the second chart that it is explained by the extremely high percentage of families who graded the school an 8, 9 or 10 and the extremely low percentage of families who graded the school a 1, 2 or 3 (in fact no families graded the school a “1” or “2”) – both of those things were not (as) true last year. This is surely good news, but let’s dig deeper…
A few things jump out…
- The topline number is up, fairly significantly, from 7.11 to 8.0. This marks the first time we have reached that threshold.
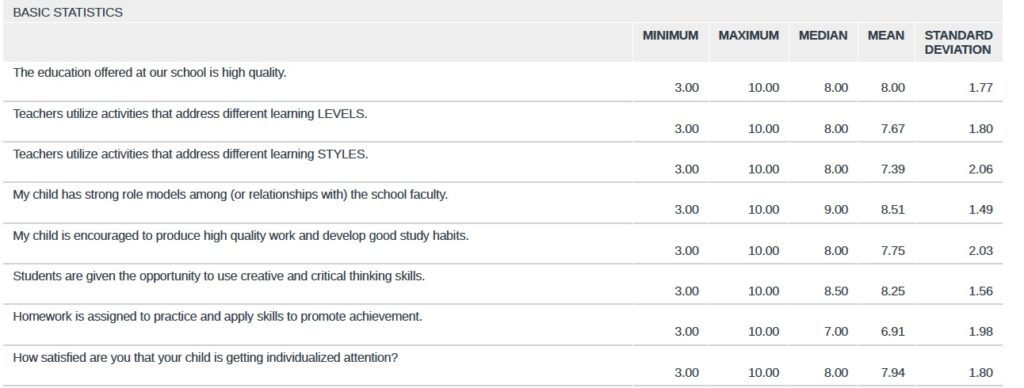
- Both learning “LEVELS” and learning “STYLES” have also crossed the threshold from the less healthy high 6’s into the mid 7’s. It would be nice to know how much of this is attributed to improvement in general and how much to how the school has responded to distance learning, but we will have that same question to answer with almost all the data.
- I am very pleased to see that every single category is up from the prior year and that all, but one, in this section are now firmly in the healthy 7-9 range.
- I am thrilled to see such a high score (8.25) for “creative and critical thinking skills”.
- Our lowest score (again) is again in “Homework” although it has climbed from 6.56 to 6.91, putting it just outside the healthy band. As I wrote about in my self-evaluation, it is hard to know if the full implementation of our new Homework Philosophy was hindered by COVID-19, but we will look to see if this score goes up with another year of implementation under our belts.
- Hereto, every metric is higher than last year and we still want to see each one climb a little higher.
- The topline number has moved from 6.61 to 6.97, which is so close to being a 7, but for such an important metric, I would really like to see it closer to 8. It would be interesting to peg this question to the grade of the student captured in the data (which I cannot do in order to protect anonymity) to see if parents’ perceptions of their child(ren) as being well prepared for high school grows higher as they get closer (which would be good) to graduation.
- So thrilled to see all three of our metrics that deal with resource and IEPs to have grown and to all enter the healthy band! Kudos to Sharon Reichstein, our Director of Special Needs Education, and her team for all their work this year – work that I believe has proven even more valuable during this time of distance learning. This is a clear example over time where parent voice, aligned with teacher and student voice, leads to meaningful action. (Fill out those surveys y’all! We really do pay attention.)
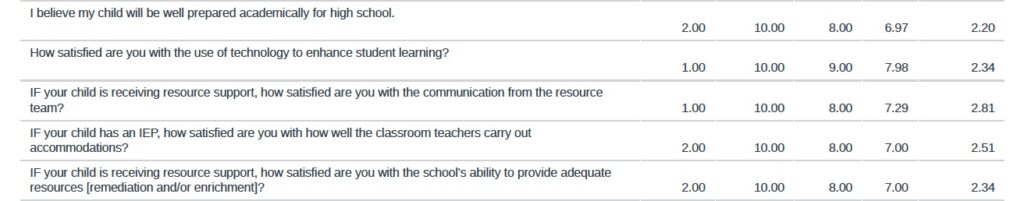
- Thrilled to see that our topline number has moved from 7.24 to 8.17!
- Very happy to see that every metric in General Studies is well into the healthy band and each one is up from the prior year:
- Math: 7.09 to 7.60
- Science: 7.09 to 7.72
- Social Studies: 7.41 to 7.96
- Reading: 6.93 to 8.0
- Writing: 6.51 to 7.07
- I would happily attribute the meaningful increase in reading to all the work our Language Arts Teachers have done with STAR Reading / Accelerated Reader, incentivizing reading in general with the “Annual Reading Challenge” and the Scholastic Book Fair, and better integrating our Library with the Classrooms.
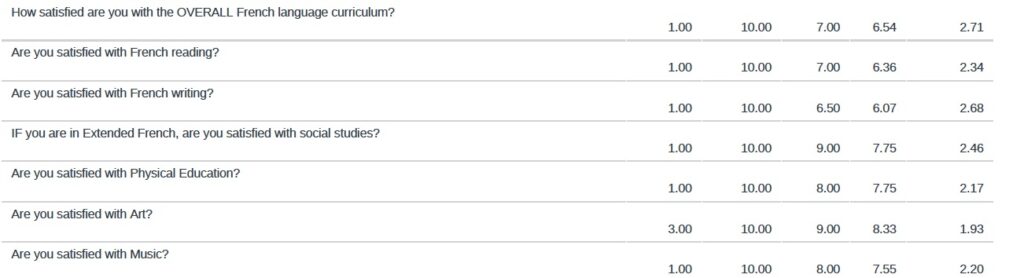
- I am of two minds when it comes to our French metrics. The positive is that all three metrics are HIGHER than they were last year at this time. That’s good news! Our OVERALL metric went from 5.66 to 6.54. French reading grew from 5.58 to 6.36. French writing went 5.35 to 6.07. Those are all meaningful jumps in the right direction. The negative, of course, is that they all still fall below the healthy band. However, another year of growth like this one would put all those categories firmly there. That should be great cause for optimism since this year’s growth can fairly be attributed to the first year of our consultancy with TACLEF – a year that got truncated by a third due to COVID-19. Immediately before we pivoted to distance learning, we posted an update on the progress we had made this year due to TACLEF. Knowing that we have another full year of consultancy ahead of us, should inspire greater confidence that our French outcomes will soon be on par with the rest of General Studies. That will be quite an accomplishment considering the narrative around French outcomes that the school has been working to flip during the last three years. Bon travail to the French Department!
- Sticking with the theme of this section, all three of our specialty classes are up as well! Congrats to the PE Teachers for leading PE from 6.84 to 7.75, to Morah Shira for lifting Art from 7.20 to 8.33, and to new Music Teacher, Mr. Goddard, for guiding Music from 6.80 to 7.56. It is good to know that even with a rigorous, trilingual curriculum, that we continue to offer the kinds of high-quality PE/Music/Art experiences that make a well-rounded education.
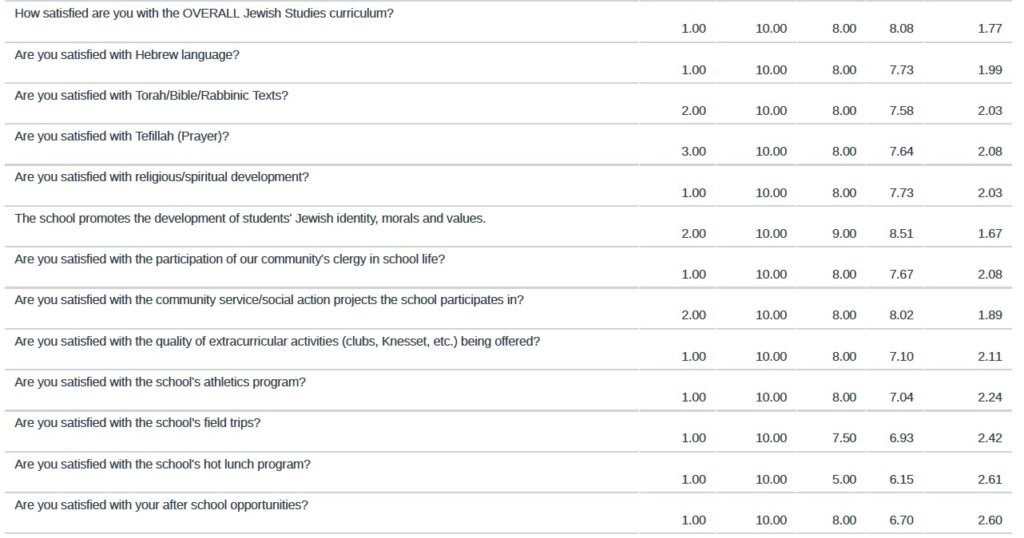
- We are again thrilled to see all our Jewish Studies metrics continue to climb higher after another year. We are especially pleased to see the OVERALL metric move from 7.29 to 8.08. With another year’s commitment to immersive Hebrew pedagogy, another year of meaningful prayer experiences, the leadership of Dr. Avi Marcovitz as our new Dean of Judaics, greater engagement of our community’s clergy, etc., we are clearly headed in the right direction. Kol ha’kavod to the Jewish Studies Department!
- We are pleased to see our extracurricular activities and athletics climb into the healthy range this year! We are pleased to see field trips go up, with the hope to see it over 7 in the year to come.
- Although our hot lunch program and our after school metrics trail behind the others, they are both UP significantly from the last year. We will continue to work with our partners and vendors and look forward to continued growth in the year ahead.
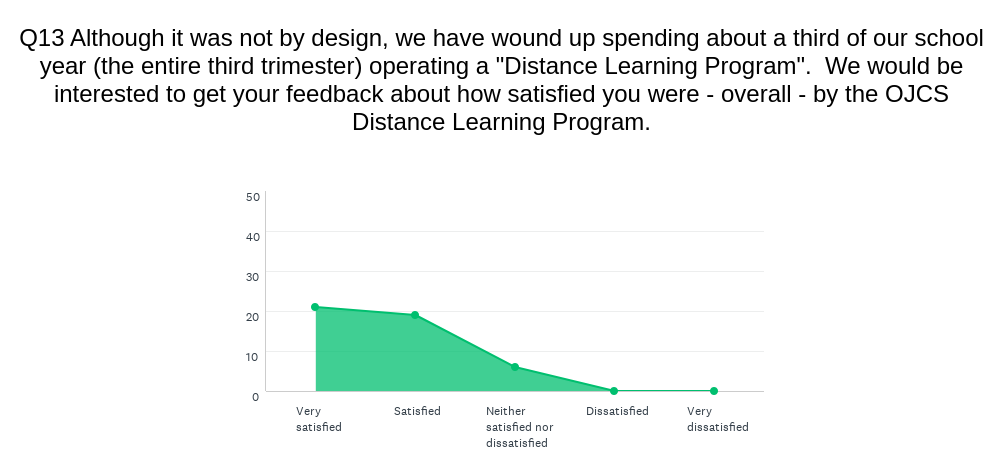
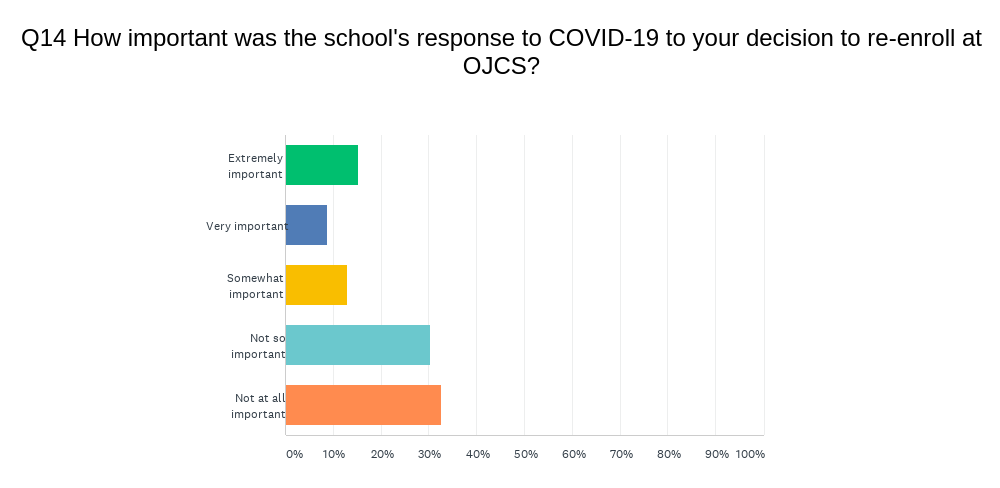
From our experimental section, we yield these two data points (and two sets of meaningful commentary). As we see it as almost an inevitably that schools will be required to pivot back and forth from school in a bricks-and-mortar building to school through distance learning, our ability to navigate that pivot with minimal disruption and maximal academic progress – not to mention with the continuance of meaningful Jewish experiences – will be powerful value-adds for OJCS in the years ahead.
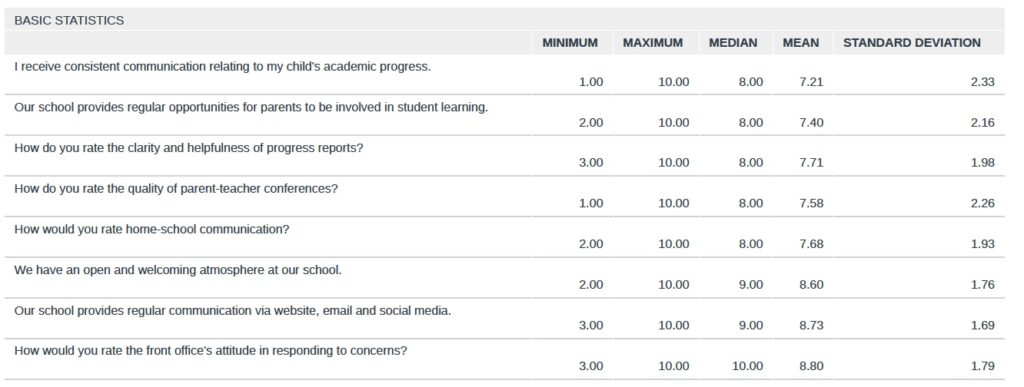
- I noticed that I did NOT include this section (Communications) in last year’s analysis (even though I am pretty sure the questions were asked), so we will let this year’s data serve as a baseline from which to judge future metrics.
- All of these scores are high into the healthy range! I like to see our “open and welcoming atmosphere” come in at 8.60, our regular communication at 8.73 and the front office’s responsiveness to concerns at an 8.80 – all of our highest scores. I think we all know that we have Ellie to thank for a lot of those high scores!
- I will be interested to see what the impact of “Student-Led Conferences” will be on the “parent-teacher conferences” metric once launched.
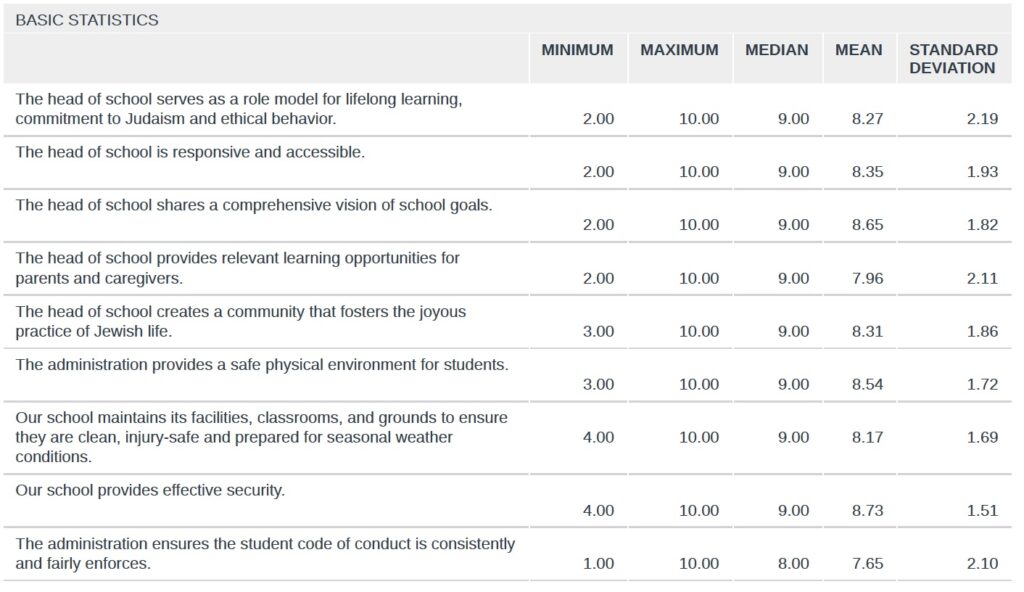
- I have already shared my thoughts on my own job performance in my prior “Transparency Files” post. I will simply state here my pleasure in seeing all these numbers climb from the prior year.
- The one metric that I am very pleased to see climb is the last one, which essentially serves as a proxy for school-wide behavior management. Last year we scored a 6.69 and I stated that, “we are working on launching a new, school-wide behavior management system next year based on the “7 Habits” and anchored in our “North Stars”. I will be surprised if this score doesn’t go up next year.” Well, it came in this year at a 7.65.
Last data point:
Remember this question was scaled 1-5. Our school has climbed from last year’s 4.14 to this year’s. 4.44. I truthfully don’t know how much more there reasonably is to grow this, but we’ll keep doing our best to find out!
So there you have it for 2019-2020!
Thanks to all the parents who took the time and care to fill out surveys! In addition to the multiple choice questions, there were opportunities for open-ended responses and a couple of experimental sections. Your written responses added an additional layer of depth; one which is difficult to summarize for a post like this. Please know that all comments will be shared with those they concern. (This includes a full set of unedited and unredacted results which goes to the Head Support and Evaluation Committee of our Board of Trustees.) As you can see each year, we really do use this data to make enhancements and improvements each year.
We want to reverse this year’s trend in terms of parent participation, but very much wish to continue this year’s trend in increasing positive outcomes and satisfaction. To mix school metaphors, each year simply becomes the higher “floor” we stand upon to reach towards our North Stars. With no ceiling, we aim to reach a little closer each time.
You should consider Ipsos CX for your Annual Parent Surveys- look me up! We have more in common then you think – you’re very intuitive and on the mark with your insights into the data! MITZMACHER trait!