

Welcome to “Part II” of our analysis of this year’s CAT4 results!
In last week’s post, we provided a lot of background context and shared out the simple results of how we did this year. Here, in our second post, we are now able to begin sharing comparative data, focusing on snapshots of the same cohort (the same group of children) from 2019 to 2021 (with bonus data from 2018’s Grade 3). In other words, for now based on which grades have taken the CAT4 when, we can only compare at the cohort level from 2019’s Grades 3-5 to 2021’s Grades 5-7 to 2022’s Grades 6-8. [Remember, that we did not take them at all in 2020 due to COVID.] In the future, this part of the analysis will only grow more robust and meaningful.
Here is a little analysis that will apply to all three snapshots:
- Remember that any score that is two grades above ending in “.9” represents the max score, like getting a “6.9” for Grade 5.
- Bear in mind, that the metric we are normally looking at when it comes to comparing a cohort over time is whether or not we see at least one full year’s growth (on average) each year – here we are factoring an expected two full year’s growth between 2019 and 2021. As we discussed last year, that might have been the place one would have expected to see a “COVID Gap” (but we largely did NOT) and between 2021 and 2022 one might expect to see a “COVID Catch-Up”.
Here are the cohort snapshots:
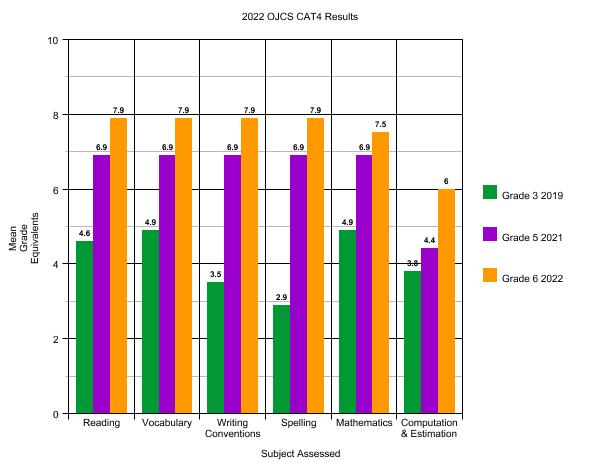
What does this snapshot of current Grade 6s reveal?
- They consistently function a full grade if not not more above the expected grade level.
- That even with COVID we consistently see at least a year’s worth of growth each year across almost all the topics.
- Technically, there is only six month’s worth of growth “Mathematics” (6.9 to 7.5) from 2021 to 2022, but that is already significantly above grade level.
- The one domain, Computation & Estimation, where they are barely below grade level (6.0), we can now properly contextualize by noting that they grew from 4.4 in 2021 to 6.0 in 2022 – more than a year’s worth of growth in a year (the year we would expect a bit of “COVID Catch-Up”. This means, that they should be more than on track to match all the rest of their scores being significantly above grade level when they take the text in 2023.
All in all…excellent news and trajectory for our current Grade 6s.
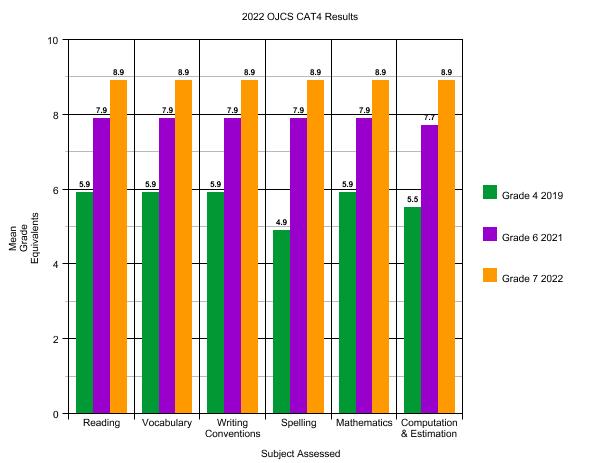
What does this snapshot of current Grade 7s reveal?
Not much! This cohort has maxed out their scores in almost every domain in almost each year! And in the few places they did not, they were still above grade level – like “Spelling” (4.9) and “Computation & Estimation” (5.5) in 2019 – and grew at least a full grade level each year so that by now, in Grade 7, it is max scores all across the board! That is pretty awesome to see.
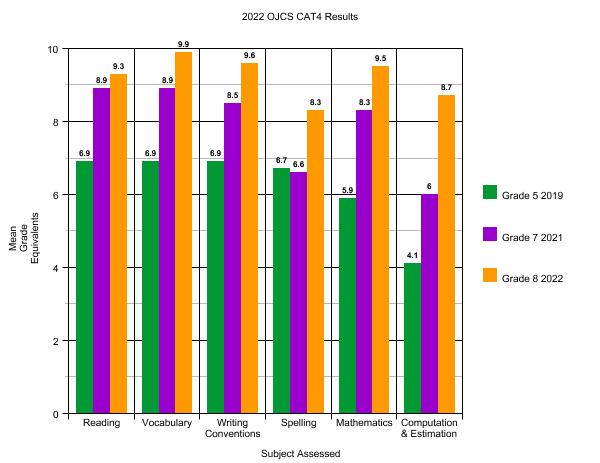
What does this snapshot of current Grade 8s reveal?
This class had a bit of stranger trajectory, but essentially ends where we would like. “Spelling” took a strange path, beginning way above grade level, plateauing with a dip where we should have seen two years worth of growth, and now fully rebounding to grade level. “Computation” had a more normal curve, but went from being consistently a year below grade level before completely catching up and now being well above.

To sum up this post, we have a lot to be proud of in the standardized test scores of these particular cohorts over time. The two areas (Spelling and Computation & Estimation) that were worthy of prioritization the last couple of years (this year’s Grades 6 & 8) were indeed prioritized. We began providing professional growth opportunities for language arts teachers in our school on Structured Word Inquiry as part of larger conversation about the “Science of Reading”. [Please check out our Director of Special Needs, Sharon Reichstein’s recent post on this issue, which I’ll also have more to say about in Part III.] With regard to Computation & Estimation, we discussed it during last year’s November PD Day which focused on “Data-Driven Decision Making” and it has continued to be a point of emphasis. The results indicate that these efforts have borne fruit.
The Math and Language Arts Teachers in Grades 3-8 have now begun meeting to go through CAT4 results in greater detail, with an eye towards what kinds of interventions are needed now – in this year – to fill any gaps (both for individual students and for cohorts); and how might we adapt our long-term planning to ensure we are best meeting needs.
Stay tuned next week for the concluding “Part III” when we will look at the same grade (different students) over time, see what additional wisdom is to be gleaned from that slice of analysis, and conclude this series of posts with some final summarizing thoughts.