

Welcome to “Part III” of our analysis of this year’s CAT4 results!
In Part I, we provided a lot of background context and shared out the simple results of how we did this year. In Part II, we began sharing comparative data, focusing on snapshots of the same cohort (the same group of children) from 2019 to 2021 (with bonus data from 2018’s Grade 3). Remember, based on which grades have taken the CAT4 when, we were only able to compare at the cohort level from 2019’s Grades 3-5 to 2021’s Grades 5-7 to 2022’s Grades 6-8. [Remember, that we did not take them at all in 2020 due to COVID.] In the future, that part of the analysis will only grow more robust and meaningful. We also provided targeted analysis based on cohort data.
Here, in Part III, we will finish sharing comparative data, this time focusing on snapshots of the same grade (different groups of children). We are able, now, to only provide data on Grades 5-8 (from 2019, 2021, & 2022, with bonus data from 2018’s Grade 6), but in future years we’ll be able to expand this analysis downwards.
Here is a little analysis that applies to all four snapshots:
- Remember that any score that is two grades above ending in “.9” represents the max score, like getting a “6.9” for Grade 5.
- We are no longer comparing the same children over time, as when it comes to analyzing a cohort, therefore we aren’t looking for the same kinds of trajectories or patterns in the data. You could make a case – and I might below – that this part of the data analysis isn’t as particularly meaningful, but we go into it open to the idea that there may be patterns or outliers that jump out and warrant a thoughtful response.
- As we have mentioned, the jump between 2019 and 2021 might have been the place one would have expected to see a “COVID Gap” (but we largely did NOT) and between 2021 and 2022 one might expect to see a “COVID Catch-Up”.
Here are the grade snapshots:
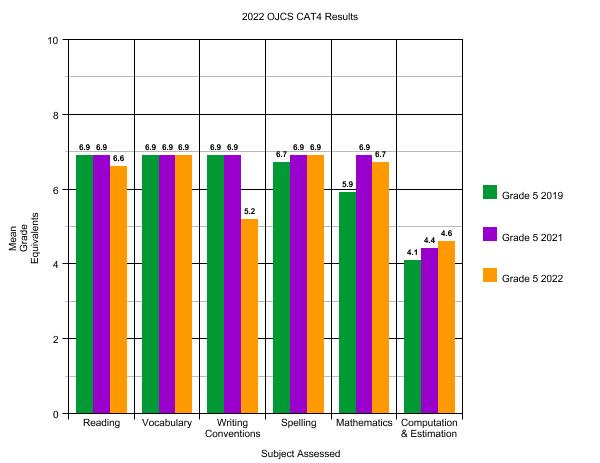
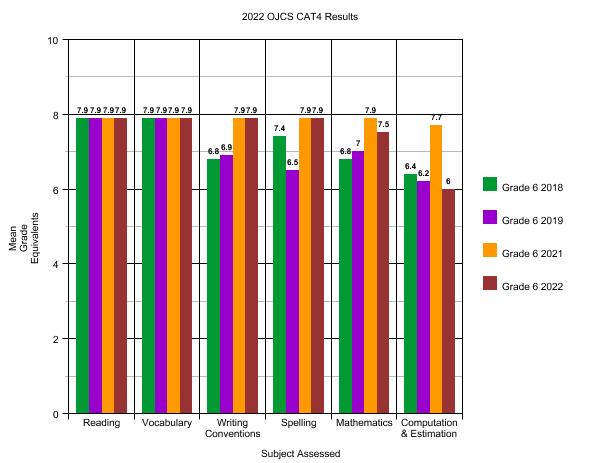
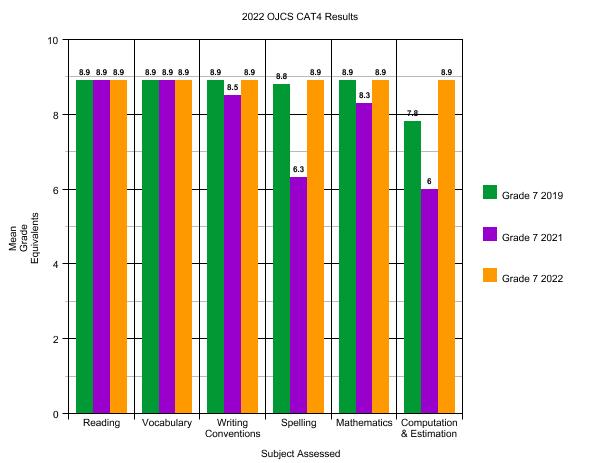
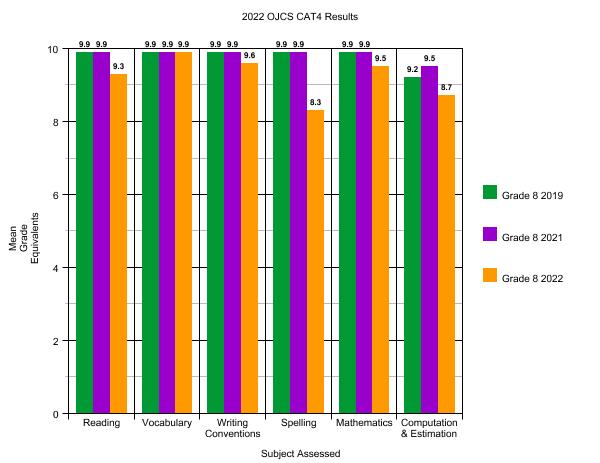
What do these grade snapshots reveal?
- Again, keeping in mind that we are not tracing the trajectory of the same students, outliers like “Spelling” and “Computation & Estimation” for Grade 7 in 2021 help us understand that whatever is happening there is more a function of the cohort than the grade, which means that the remedy or intervention, if needed, has less to do with the curriculum or the program in Grade 7 and more to do with better meeting the needs of that that particular cohort of children. [And you can see how that played out and with what results by cross-checking with the cohort data in Part II.] To be clear we aren’t suggesting that the only explanation for their outlier status is about them that it is the children’s fault! The deeper dive into the data helps clarify that this is not a “Grade 7” issue, it doesn’t absolve us from better understanding or applying a remedy.
- You can see a little of the reverse by looking at “Computation & Estimation” in Grade 6. Now, in this case we are only dealing with being at grade-level or above, but you can see that Grade 2021’s relatively higher score (7.7) is an outlier. If the goal was to have each Grade 6 score nearly a grade-and-a-half above – which is certainly doesn’t have to be – you would look at the data and say this is a Grade 6 issue and we’d be looking at how students come out of Grade 5 and what we do in the beginning of Grade 6. Again, this is not about intervening to address a deficit, but I use it to point out how we can use the data to better understand outliers and patterns.
- To the degree that this data set is meaningful, the trajectory that feels the most achievable considering we are dealing with different children is what you see in Grade 5 “Computation & Estimation” – small increases each year based on having identified an issue an applying an intervention.
- The bottom line is essentially the same as having viewed it through the cohort lens: almost each grade in almost every year in almost each area is scoring significantly above its grade-level equivalencies.

Current Parents: CAT4 reports will be coming home this week. Any parent for whom we believe a contextual phone call is a value add has, or will, be contacted by a teacher.
The bottom line is that our graduates – year after year – successfully place into the high school programs of their choice. Each one had a different ceiling – they are all different – but working with them, their families and their teachers, we successfully transitioned them all to the schools (private and public) and programs (IB, Gifted, French Immersion, Arts, etc.) that they qualified for.
And now again this year, with all the qualifications and caveats, and still fresh out of the most challenging set of educational circumstances any generation of students and teachers have faced, our CAT4 scores continue to demonstrate excellence. Excellence within the grades and between them.
Not a bad place to be as we open the 2023-2024 enrollment season…
If you want to see how all the dots connect from our first Critical Conversation (Jewish Studies), our second Critical Conversation (French), our CAT4 results, and so much more…please be sure to join us for our third and final Critical Conversation, “The ‘Future’ of OJCS” on Thursday, February 9th at 7:00 PM.