

It is that time of year again…but, perhaps, it may not continue to be “that time of year” – at least in this format – into the future…
As our enrollment continues to increase and our participation in the Annual Parent Survey continues to flatline – our survey has gone from covering 81 students to 84 students to 54 students to 58 students to 52 students and this year, the majority of questions were only answered by families covering 45 students. That barely captures one quarter of our student population and it is only fair to ask, at this point, whether or not this continues to be the best way to solicit meaningful and actionable data. Because that is the reason we do this – to learn how to continue to grow as a school. Without three-quarters of the students accounted for, the data can only be so meaningful. Without casting any aspersions about who is, or who is not, more likely to fill these surveys out, the odds of this 1/4 mapping onto the opinions of the remaining 3/4 seems long at best. As the survey is per student, not per family, it runs the risk of being even less representative than that. (In the service of anonymity, we have no way of knowing how many families the survey actually represents.)
Our goal of 50% seems more and more unrealistic each year.
So, after this year, we are going to have a think. We could incentivize families to fill this out, as some parents have suggested. We could consider moving to a model where we do focus groups some years and surveys other years. Perhaps if we hired a third-party vendor to issue the survey, analyze the data and share the report, people would be more comfortable believing it is as anonymous as it is (it is!), or have more faith in an unbiased deliverable. Either way, I think it is time to acknowledge that this methodology is no longer serving its intended purpose and the goals of receiving feedback and sharing it transparently likely require a new approach.
But that’s for next year…for now, instead of worrying about the motivations for why families did or didn’t fill out surveys, let’s thank the parents who did participate and try to make meaning of what they are telling us. [If you would like to see a full comparison with last year, you can reread those results, or have them open so you can toggle back and forth. In this post, I will try to capture the highlights and identify what trends seem worth paying attention to.]
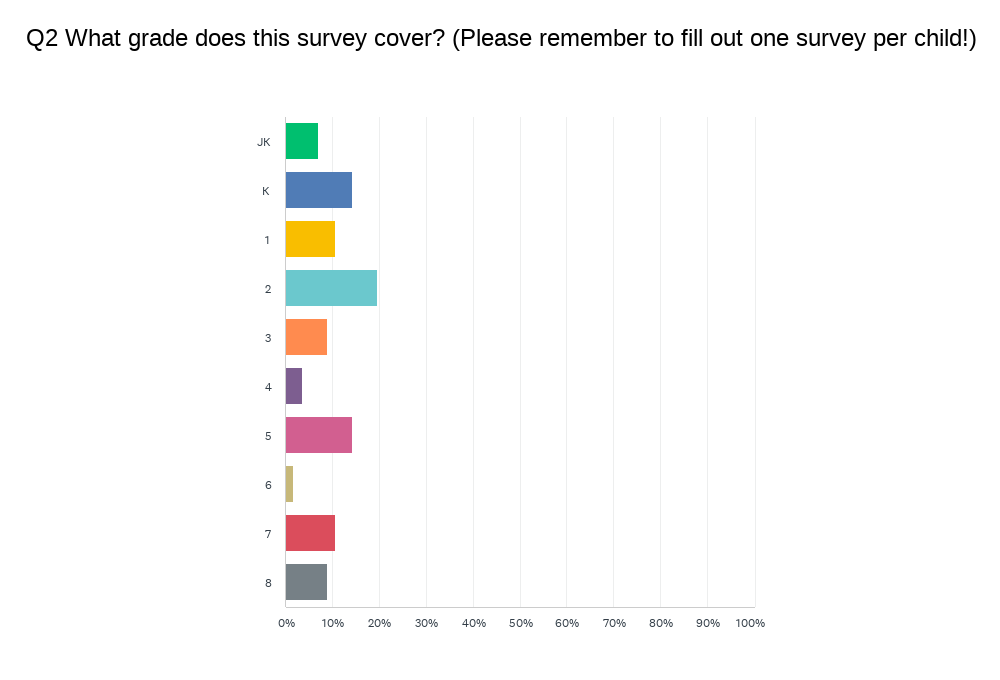 For a third straight year, we have more spread than normal. It is more typical to have a big cluster in the youngest grades with diminishing returns as you get older. Again this year, we have a healthy (if low) distribution across most of our grades.
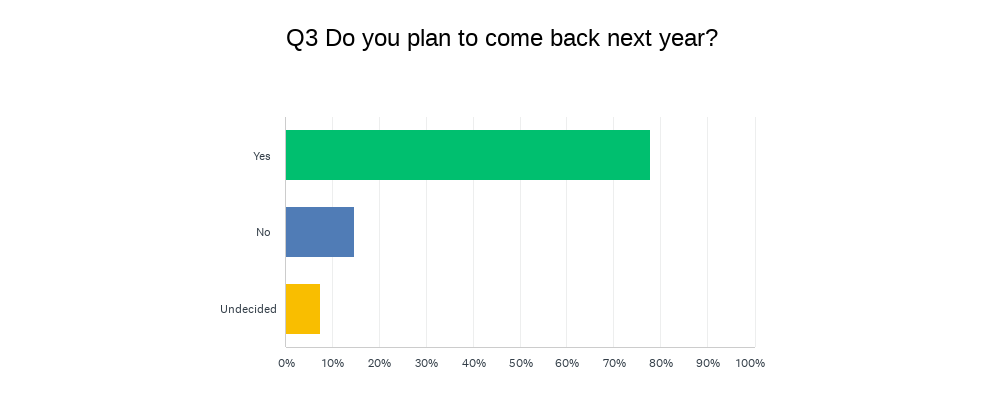
Without knowing how representative this quarter of students is, this year’s data set is heavier on the “no’s”. Of course the “no’s” are always complicated to unpack because we have no way of knowing who of the “no’s” represent graduation or relocations, as opposed to choosing to attrit prior to Grade 8. [If a higher percentage of the small number who attrit are represented in these results than in prior years, it would provide added context for the results.] However, what continues to be true is that the overwhelming majority of families – regardless of their feedback – stay with us year-after-year. This continues to say a lot about them and a lot about us.
Let’s look at the BIG PICTURE:
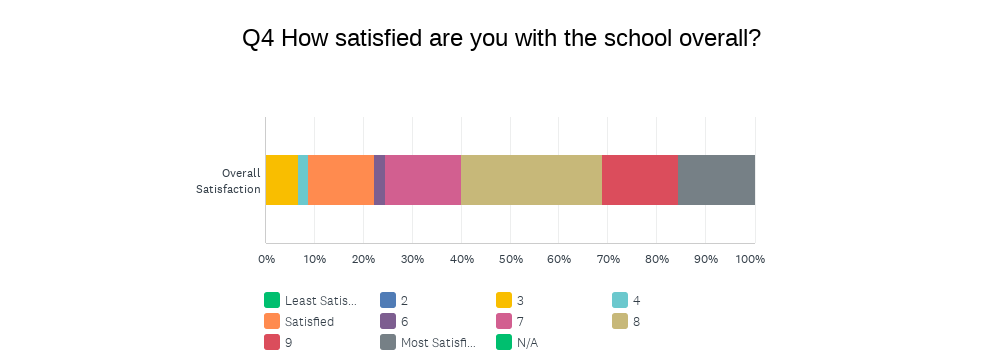
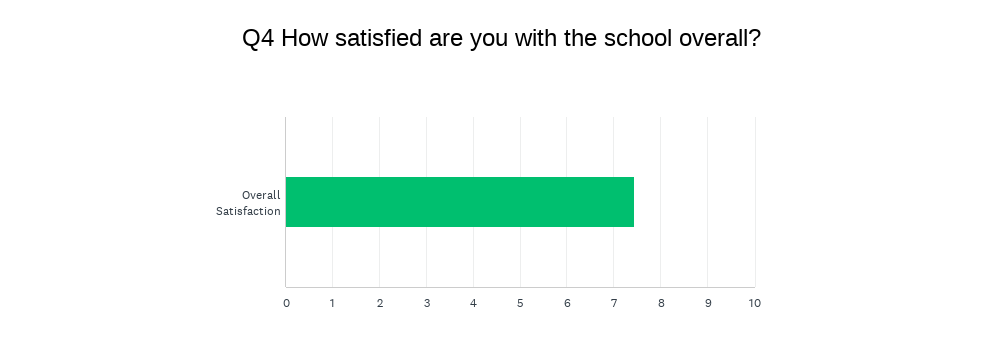
The first chart gives you the breakdown by category; the second chart gives you the weighted average satisfaction score (out of 10). I will remind you that for this and all categories, I look at the range between 7-9 as the healthy band, obviously wanting scores to be closer to 9 than to 7, and looking for scores to go up each year. In terms of “overall satisfaction”, we have now gone from 7.13 to 7.20 to 8.17 to 7.91 to 8.0 to 7.44. Although it is a tick down from last year, the difference is statistically insignificant.
The one thing that jumps out here that will continue throughout all the data is that the “standard deviation” is much higher than in prior years. Meaning, we have higher concentrations on both ends than normal – which combined with the low engagement probably explains the most about the data above and below. This 1/4 of the student population could capture more families with the strongest feelings than in a typical year.
However, overall, this continues to be a good news story, but let’s dig deeper…
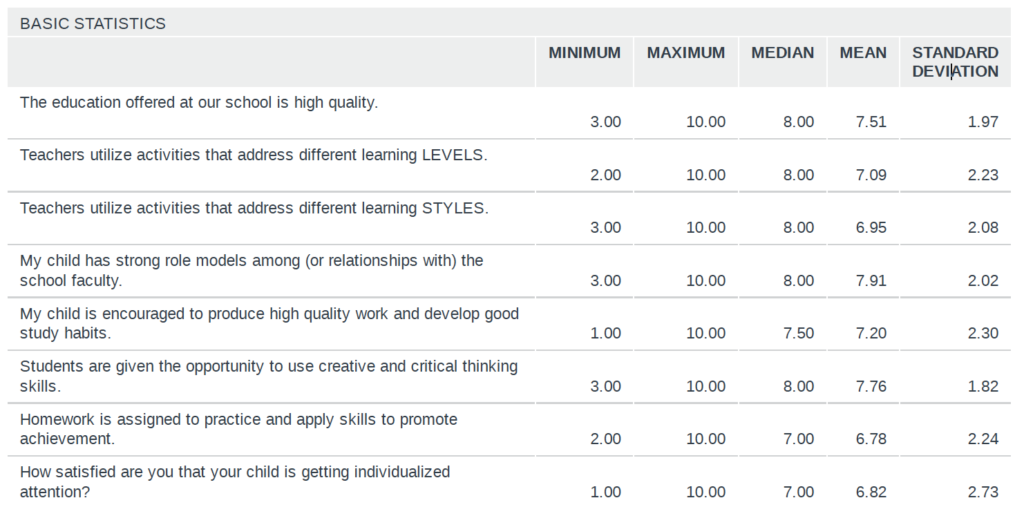
- The overall theme, which I have been suggesting above and will carry forward is that almost every single category is slightly down. That is not a trajectory that pleases us, even with all the possible caveats and contexts. We like numbers to go up; we don’t like when numbers go down. However, because they are consistent all across the board, it is a bit challenging to identify one issue, program or idea to work on. I’ll have more to say below.
- It remains true, however, that even with this disappointing trend line, all data points (here) round into the acceptable range. So we don’t like the way the arrow is facing, but this constitutes a challenge, not a crisis.
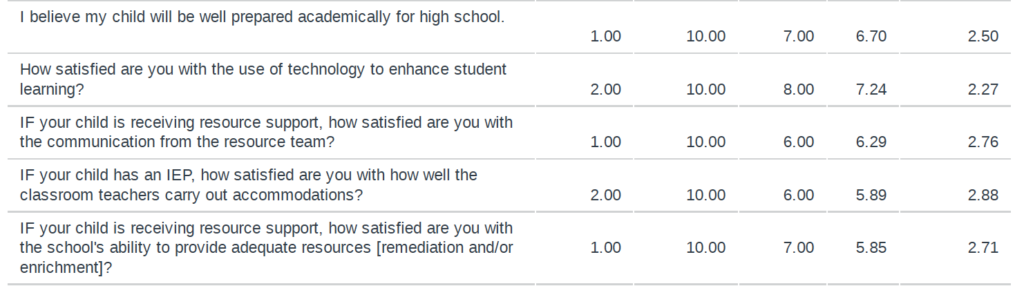
- I won’t repeat the same comment each time – each score being slightly down, but mostly in the acceptable range.
- The one thing that jumps out from this, which we know, is that the school has been trying to provide the same level of quality in terms of “resource” with the same staffing structure spread across +40 students. Meaning, during my six years at OJCS, we have over 40 more students in our school and the same number of personnel allocated to providing resource support – whether that is direct services to students, coaching and support for teachers in making accommodations, or even the customer service of reporting back and forth with parents. We keep trying to do more with less, and if this data yields anything actionable it is this – even leaving aside potential differences in philosophy; we are not yet adequately staffed to deliver on our promise to parents.
Action to follow. Watch this space.
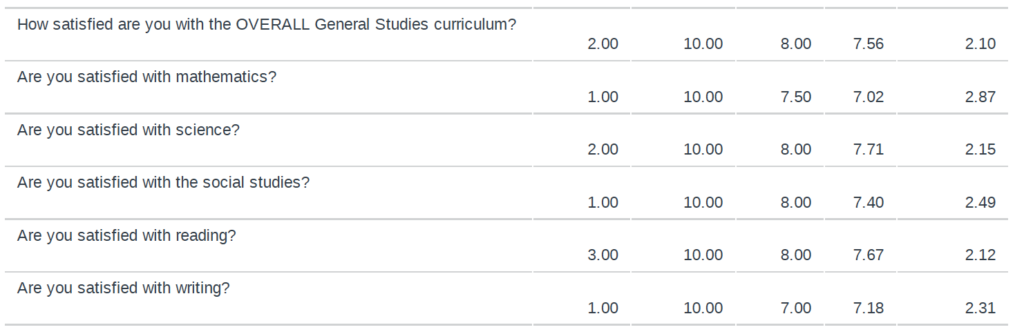
- Now this data set is revealing. This is the first section that does not indicate a meaningful dip. Despite the concerns above, this same set of parents has given us very high marks for General Studies.
- With a full year in the Makerspace, with having done meaningful PD on the “Science of Reading”, and an overall return to business as usual, it is nice to find all our scores in the acceptable range (especially in a “down year”) in the category that most parents would deem paramount.
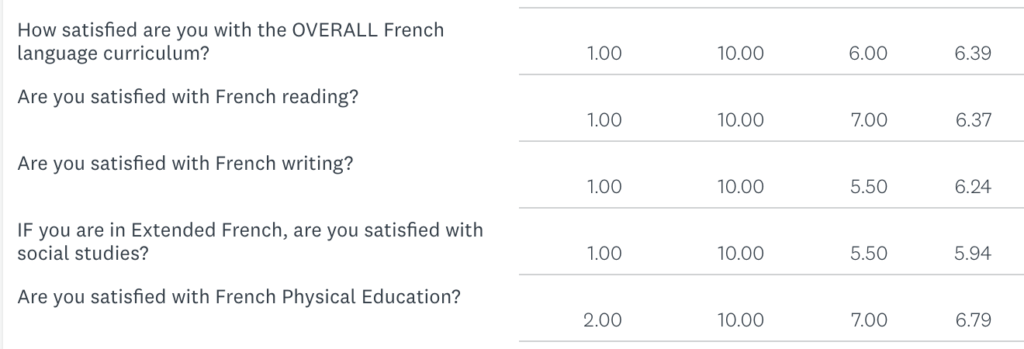
- I would like these numbers to be higher, of course, but they are fairly in line with prior years. One would have hoped that the added emphasis this year – the DELF, the investment in new curricular materials, etc., – would have yielded higher results, but the anonymity makes it hard to know how many students represented in this survey are in Core French, Extended French, etc. I do know how hard our French Faculty work, so bon travail to the French Department as we continue to raise the bar each year.
- I am very pleased with a baseline 6.79 for the first year of French PE – that rounds into the acceptable range with lots of room to grow.
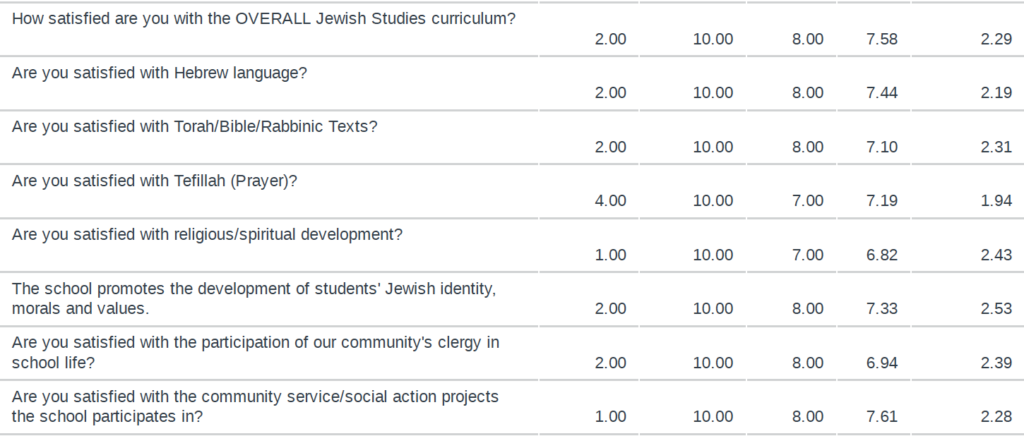
- We are pleased to see all our Jewish Studies metrics continue to hold strong for another year. Considering, that we have transitioned away from a “Head of Jewish Studies” model (for now), this is especially encouraging. Kol ha’kavod to the Jewish Studies Department!
- Last year I said that, “I am taking the slight dip in “Tefillah” as a personal challenge! It is my favourite subject to teach (students) and to coach (teachers) and I am going to make it my mission to push prayer past 7.0.” Mission accomplished!
- Last year, I said that, “I am also going to – assuming a return to normal – encourage our community’s rabbis to resume a greater role in Jewish life at OJCS.” Well, it went up…but we could and will do more.
![]()
- Great job Mr. Ebbs for keeping our Art Program moving in the right direction!
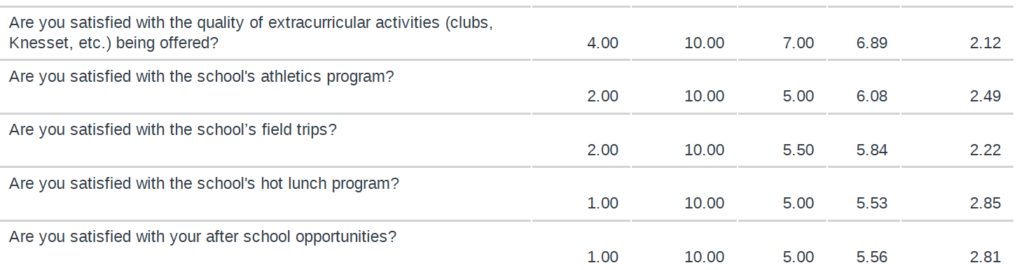
- Coming out of COVID, it is nice to see that both Extracurricular and Athletics have ticked up a notch!
- Hot Lunch and After School Programming have ticked down a bit – these are areas where we work with partners and we’ll be carrying these results to them in order to see where we can improve for next year.
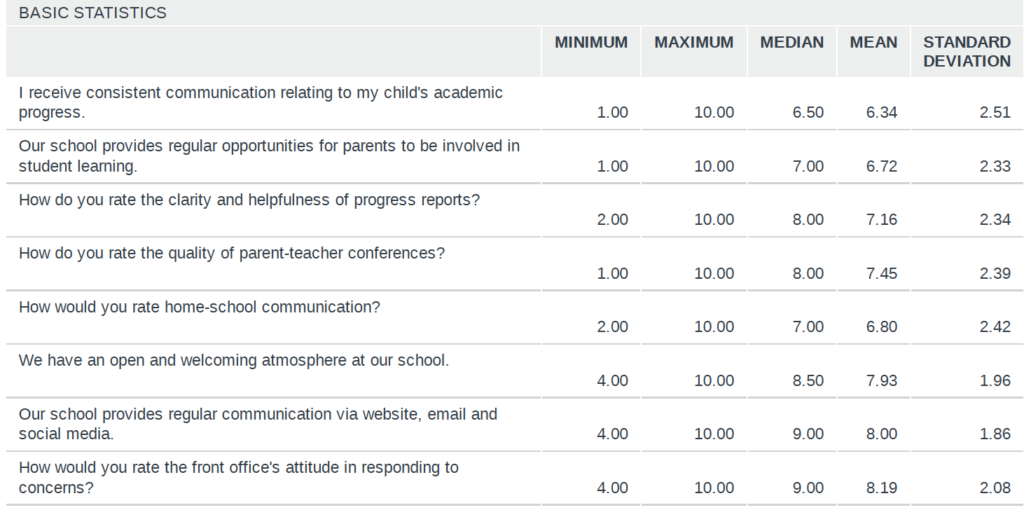
- These are mostly wonderful scores, all just about the same and well into the healthy ranges. We know that we have our teachers and Ellie to thank for a lot of those high scores!
- We will be making meaningful changes next year to our academic calendar – which will include when and how we schedule Parent-Teacher Conferences. We are excited to share this with you soon and think that will have a positive impact on how parents receive feedback on their child(ren)’s academic progress. Stay tuned!
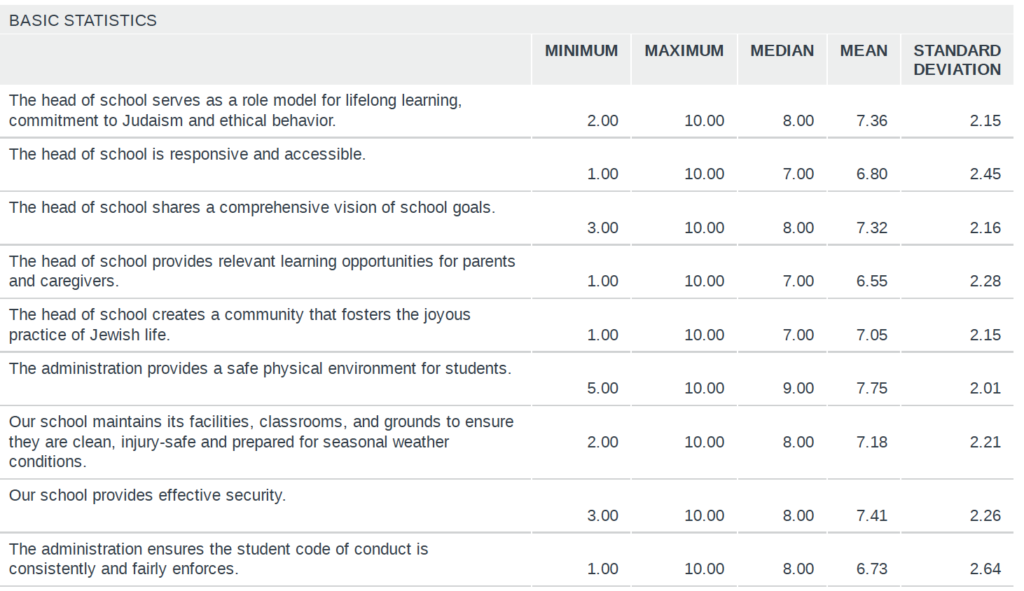
- I have already shared my thoughts on my own job performance in my prior “Transparency Files” post. I will simply state here my numbers, like all the above are largely the same, with the same across-the-board dip. The one data point that I will be reflecting on is my “responsive/accessibility” – I’d like to see this trend upwards in the year to come.
- The one metric that I am disappointed to see take a dip down after three straight positive years is the last one, which essentially serves as a proxy for school-wide behavior management. Four years ago we scored a 6.69 and I stated that, “we are working on launching a new, school-wide behavior management system next year based on the “7 Habits” and anchored in our “North Stars”. I will be surprised if this score doesn’t go up next year.” Well, three years ago it came in at 7.65, two years it climbed up to 8.19, and it remained high at 7.85 last year. 6.73 puts at back at square one – even if it rounds into the acceptable range, and even with a small sample size. Parents at OJCS can expect to see significant attention being paid to overall behavior management in 2023-2024.
Last data point [Remember this question was scaled 1-5.]:
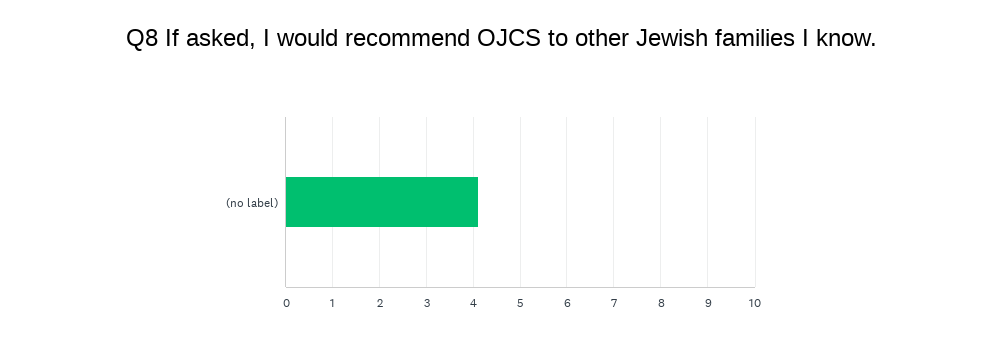
Our score remains consistent from 4.44 to 4.34 to 4.34 to 4.14. Considering the overall results, this is a fairly positive data point, even if the trend line is not what we would prefer.
So there you have it for 2022-2023!
Thanks to all the parents who took the time and care to fill out surveys! In addition to the multiple choice questions, there were opportunities for open-ended responses and a couple of experimental sections. Your written responses added an additional layer of depth; one which is difficult to summarize for a post like this. Please know that all comments will be shared with those they concern. (This includes a full set of unedited and unredacted results which goes to the Head Support and Evaluation Committee of our Board of Trustees.)
As I said at the beginning, without meaningful data we don’t know how high to put the “floor” we stand upon to reach towards our North Stars. We will likely look to change our feedback loop to ensure we hear more from more families. That way, we can make sure that without a ceiling, we aim to reach higher each year…