
Another strange confluence of secular and Jewish holidays means that the beginning of the end of the 2014-2015 school year is upon us. Being in my first year in ten not serving as a head of school, I am not sure how accurate my “how quickly the year has gone by-omoter” is, but it does seem that summers are shorter than ever. As soon as you wrap up your last teacher meeting, you are planning for next year’s first! My hope is that all of our schools – their professionals and volunteers – will take the time this summer to relax and recharge, to look back in pride and look forward with anticipation, and to be as fully present with family and friends and we know they are to a fault with students and their families.
Here at Schechter we, too, want to begin wrapping up this historic first year of rebirth and regrowth and look to learn how we can be even better at meeting the needs of our schools and the field in the year to come. I have shared some reflection on how I think my first year as Executive Director has gone, and indicated places where I believe I need to learn and grow to do and be better next year. Here, I will share the feedback we received from our first Annual Membership Survey. In the weeks to come, we will lay out more detail about our programmatic agenda for next year and how feedback may have played into our decision-making process.
A few thoughts before the data…
This survey was completely anonymous. We have no idea who filled it out. It was sent to the entire family of Schechter schools (full and affiliate members) which numbers nearly 90 schools. We received 18 responses, which by percentage is appropriate for an online survey, but is only representative to a degree. The data will be taken seriously, regardless, but we know that the larger the sample size, the higher the degree of validity. One clear goal for the future will be to inspire more completed surveys.
The complete results have been/will be shared out. Although space will not allow each question’s answers to be shared and analyzed and open-ended responses will not be quoted in full, the entire survey – all responses, regardless of how positive or negative, – has been or will be shared transparently with all the staff and lay leaders who benefit from such knowledge. We as staff cannot plan effectively for the future without be willing to listen. We as staff cannot be evaluated effectively by our lay leadership without being willing to be vulnerable.
There are no trends! This is the first year of the survey so we can only use it as a baseline upon which future years are compared. Only with future data can we see if we are truly listening to feedback and growing from it.
OK, without further adieu let’s take some highlights from the survey.
First up…who took the survey?
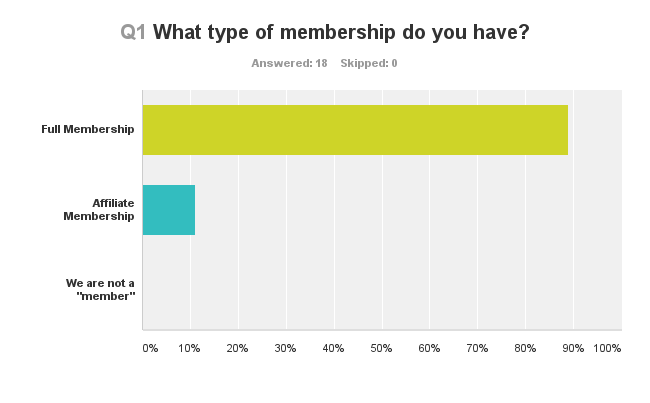
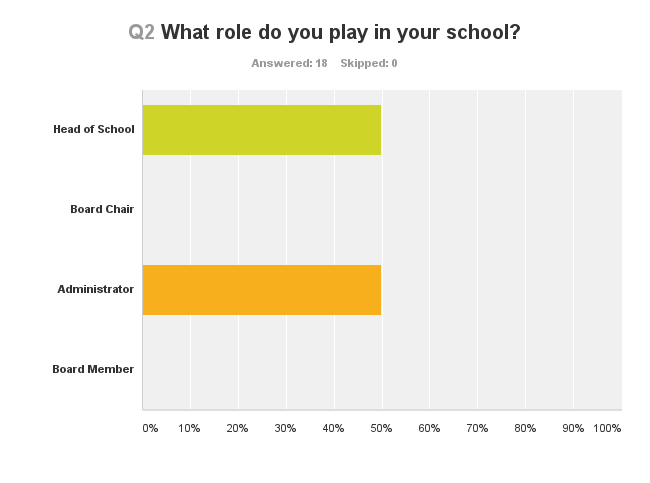
No surprises here…professionals at our full member schools are the most invested and knowledgeable about our activities.
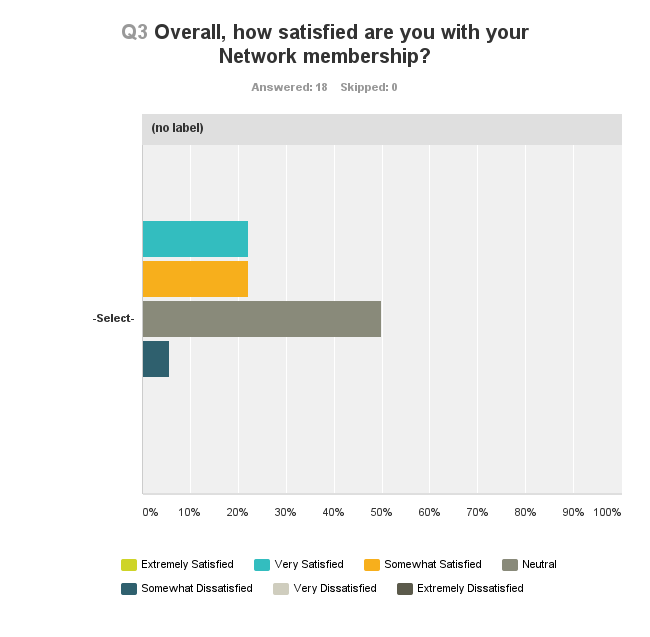
OK. Big picture. How did we do?
Hmmm…
…let’s say that there is always a temptation only to be transparent when you love what you are sharing and an equally strong temptation to be defensive about anything that is less than perfect. So long as I have say, Schechter will always be willing not only to hear the difficult truths that spur genuine growth, but the courage to share where we have fallen short in order to be held accountable.
So, on the one hand, obviously being good students we want to have the highest grades and this graph does not show that. I will say that the scale itself may not be ideal with seven categories and “neutral” as the middle. If “neutral” is “average” or “satisfied” then I could be inclined to feel good (enough) about how we did. The overwhelming majority would, in that case, be satisfied and then some. Great! If, however, “neutral” is something worse, then I am going to be more concerned with why half the respondents felt less than about our Network.
We will definitely use this as inspiration. Maybe it’s who responded (don’t be defensive!). Maybe it’s the scale (don’t make excuses!). Maybe it actually means we did great (don’t put your finger on the scale!). Or maybe it means we have real work to do. I don’t know from this alone…but I can promise you we will work hard to leave no doubts moving forward.
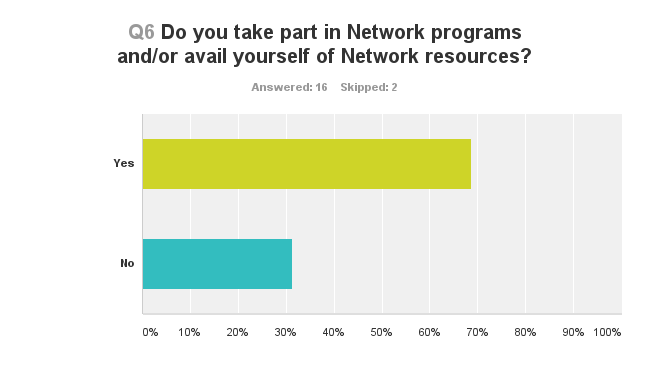
What else do we need to know?
Hmmm…
Greater analytics would need to see if those who said “no” also rated us near the bottom. Meaning, did the schools who are using our programs/resources rate us higher than those who didn’t? That would mean we need to do more work to ensure that more of our schools are aware and/or want to make use of what we have to offer. If it was the other way around, we would need to assess the quality and accessibility of our resources/programs.
What else?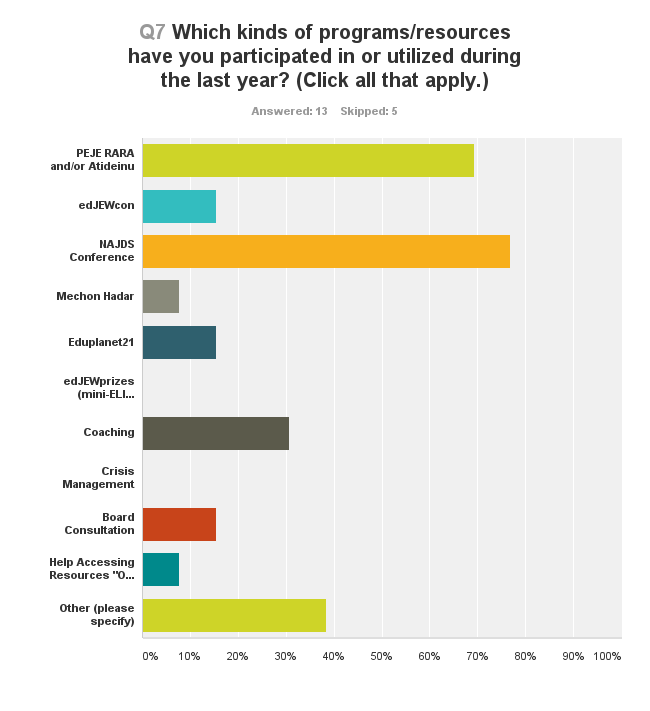
We would have liked more participation on this question to better unpack the above, but this does indicate range that pleases us. My analysis of those who checked “other” would move most of it into “PEJE” and “Coaching”. My quick read on this indicates that places we have dedicated resources are finding an audience. Again, more analytics would help us decide whether any of these responses were tied to satisfaction scores. We’ll have more to say about this when we lay out our agenda for next year.
Let’s dive deeper…
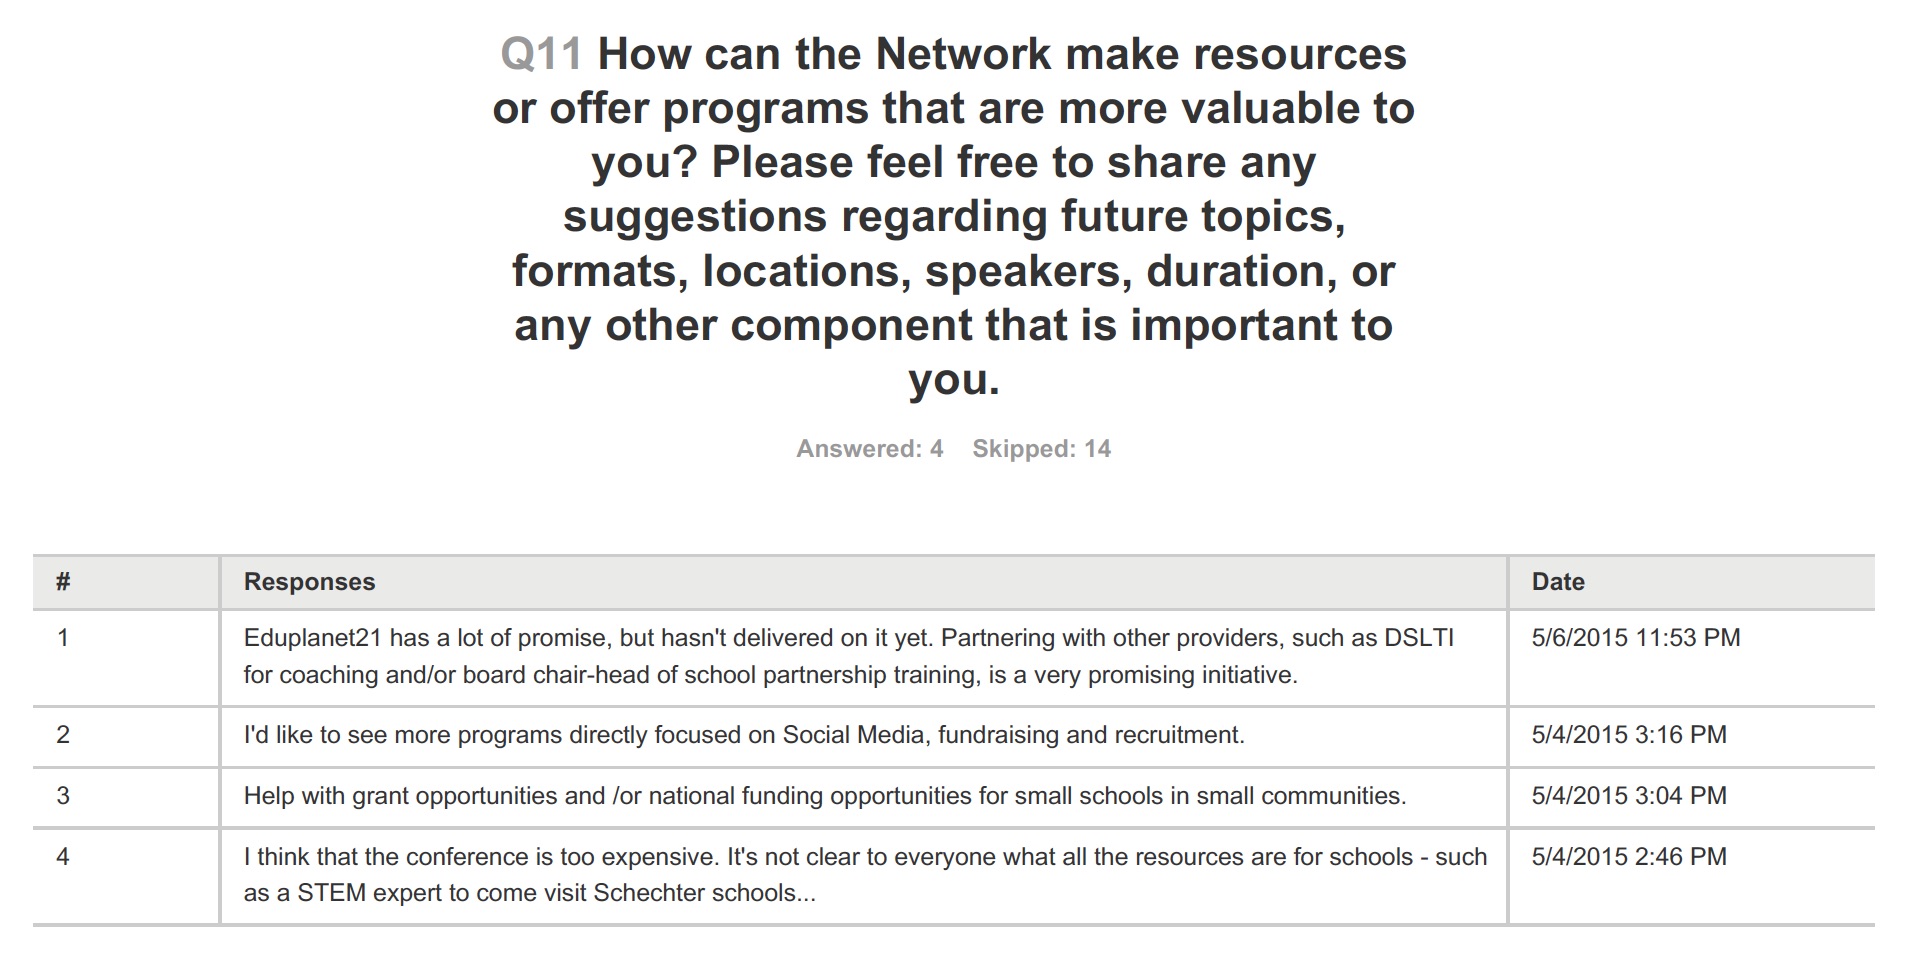
Would have loved more responses…but, yes, we agree!
Let’s keep diving…what are we doing well?
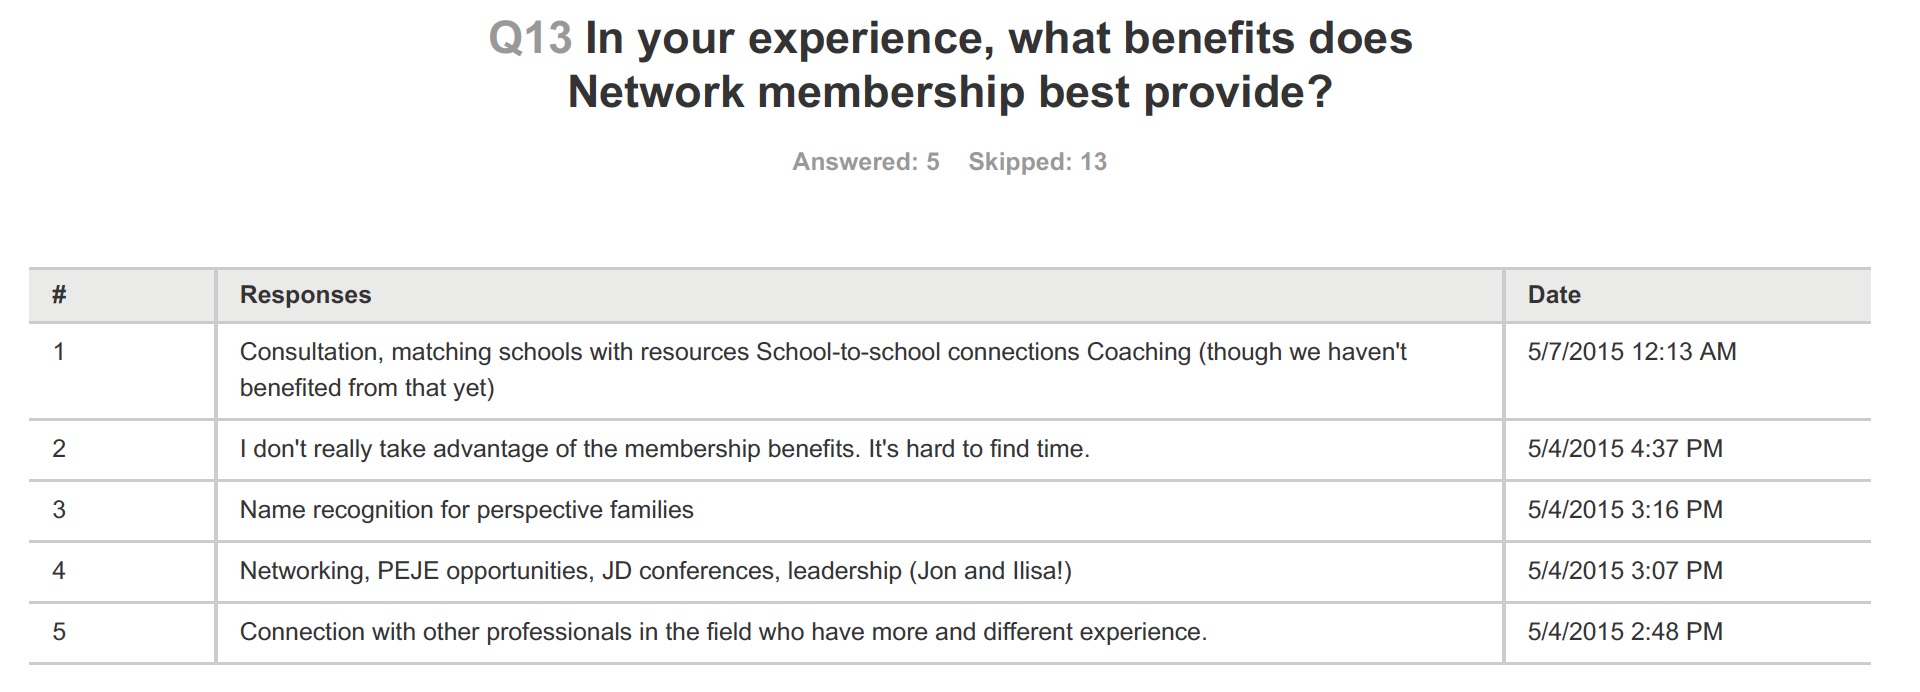
Again, would have loved more responses…but we appreciate the feedback!
Here was the biggest surprise (to me):
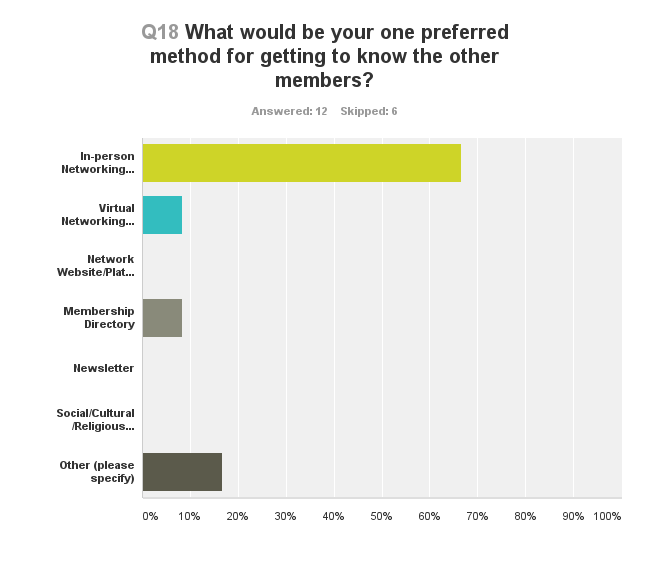
If this response is representative it has implications for our programs, our thoughts of “region” and “cohort” and the challenges for schools geographically apart.
Final comments?
The survey may be closed, but your opportunity to provide feedback never is. Please use the comments for this blog, send us an email, pick up the phone, or just let us know when we see you in person.
This has been a year of many firsts. Next year be a very different kind of year. But one first we can look forward to a year from now is having an opportunity to compare next year’s survey with this one and to check how we listened, how we responded, and how we grew to better meet your needs. I can neither predict nor promise what it will say.
But I can predict and promise that no one will work harder than we will to live up to our obligations and our promises…
One thought on “The Transparency Files: Annual Membership Survey”
Comments are closed.