Welcome to “Part II” of our analysis of this year’s CAT4 results! In Tuesday’s post, we provided a lot of background context and shared out the simple results of how we did this year. Here in our second post, we are now able to begin sharing comparative data, however patchy. It will take at least one more non-COVID year before we can accurately compare the same grade and the same cohort year after year. But we can get a taste of it with Grades 5-8. What you have below are snapshots of the same cohort (the same group of children) from 2019 to 2021 (with bonus data from 2018’s Grade 3):
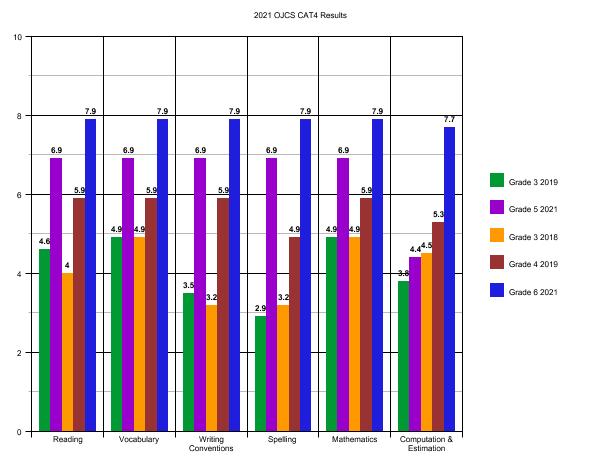
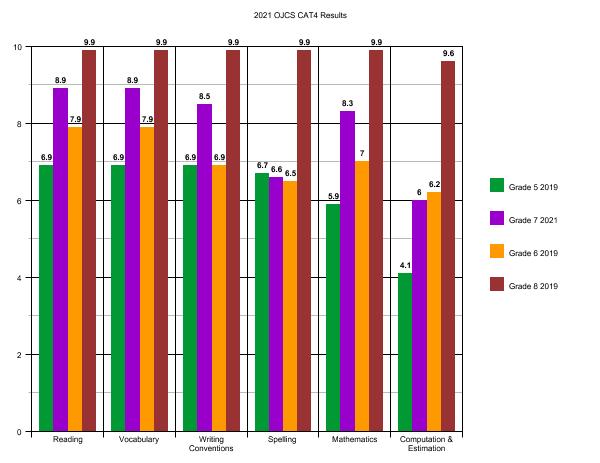
What are the key takeaways from this comparison (remembering that any score that is two grades above ending in “.9” represents the max score, like getting an “8.9” for Grade 7)?
Now bear in mind, that the metric we are normally looking at when it comes to comparing a cohort over time is whether or not we see at least one full year’s growth (on average) each year – here we are looking to see two full year’s growth since we last took the test in 2019. This would be the place one might expect to see the full measure of COVID’s impact – these are the two years of COVID between the two tests. However, for all four cohorts in all categories save two (2019 Grade 3 to 2021 Grade 5 “Computation & Estimation” and 2019 Grade 5 to 2021 Grade 7 “Spelling”) you see at least two full year’s growth (technically 2019 Grade 5 to 2021 Grade 7 “Computation & Estimation” was just shy) and in may cases you see more than two full year’s growth.
I’m going to say that again.
During the time of the pandemic, with all the pivots back and forth, all the many challenges of both hyflex and at-home learning, all the prolonged absences by many students (and teachers), with all the social and emotional stress and anxiety, with everything we know about what COVID has been doing to children and to families, in almost each category that we tested our students in Grades 5-8 – spending no time or energy preparing for the exams and with diverse and inclusive classes – in 22 of 24 domains we see at least the pre-COVID expected two-year gain, and in many cases we see more than two full year’s growth.
As was true with our overall scores, I was expecting to see a significant number of gaps for all the reasons I just described, but surprisingly and encouragingly, that is not what the data yields.
Let’s look at one more set data points. We can also get a taste of how the same grade performs from one year to the next as well. Again, we only have Grades 5-8 to look at with (with a bonus 2018 Grade 6):
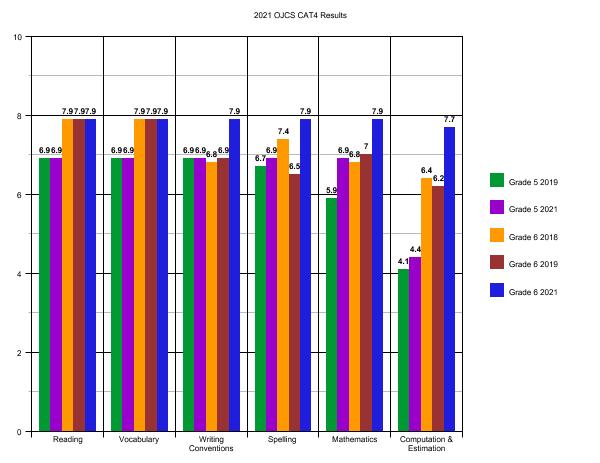
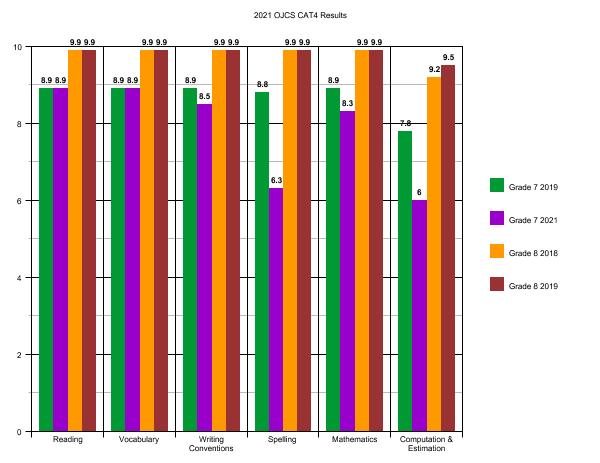
Now, remember that these scores represent a completely different group of children, so it is not unusual or surprising to see variances. Teachers can only grow students from the place they received them and it is that annual growth that we are concerned with. But over time you are looking for patterns. Ideally each domain settles in at least a full grade above with slight fluctuations from year to year depending on that year’s particular constellation of students. Even-better would be to see slight ticks up each year as a result of new ideas, new pedagogies, new programs, etc. And that is actually where much of the story currently is.
In the places where we aren’t quite where we want to be, we still have work to do. If with additional data we come to believe that Spelling or Computation & Estimation are institutional weaknesses, we will want to know whether they are weakness in every grade or do they dip in certain grades. Between COVID and gaps in testing, we simply have no way to conclude much more than we have already laid out. But in another year or so, we will be able to plot the trajectory of both cohorts (the same students) and grades over time to see what additional stories they tell.

To try sum up both posts, we have a lot to be proud of in our standardized test scores. We have two areas (Spelling and Computation & Estimation) to prioritize in two grades (Five & Seven). With regard to Spelling, it is interesting to note that when we flagged it in 2019 as a more global concern, we began providing professional growth opportunities for language arts teachers in our school on Structured Word Inquiry. The sample sizes are too small to make grand conclusions, but it is possible that those interventions help explain why Spelling is no longer a global concern, although we do need to pay attention to where and why it is lagging where it is. With regard to Computation & Estimation, we will – like with Spelling – have an internal conversation which may lead to PD for Math Teachers.
This fits in with the work we began on our November PD Day which focused on “Data-Driven Decision Making”. The Math and Language Arts Teachers in Grades 5-8 will be meeting to go through CAT4 results in greater detail, with an eye towards what kinds of interventions are needed now – in this year – to fill any gaps (both for individual students and for grades); and how might we adapt about our long-term planning to ensure we are best meeting needs.

The bottom line is that our graduates – year after year – successfully place into the high school programs of their choice. Each one had a different ceiling – they are all different – but working with them, their families and their teachers, we successfully transitioned them all to the schools (private and public) and programs (IB, Gifted, French Immersion, Arts, etc.) that they qualified for.
And now again this year, despite all the qualifications and caveats, and in the face of the most challenging set of educational circumstances any generation of students and teachers have faced, our CAT4 scores continue to demonstrate excellence. Excellence within the grades and between them.
Not a bad place to be as we prepare to open the 2022-2023 enrollment season…

