Welcome to “Part III” of our analysis of this year’s CAT4 results!
In Part I, we provided a lot of background context and shared out the simple results of how we did this year. In Part II, we began sharing comparative data, focusing on snapshots of the same cohort (the same children) over time. Remember that it is complicated because of three factors:
- We did NOT take the CAT*4 in 2020 due to COVID.
- We only took the CAT*4 in Grades 5-8 in 2021.
- We resumed taking the CAT*4 in Grades 3-8 in 2022.
Here, in Part III, we will finish sharing comparative data, this time focusing on snapshots of the same grade (different groups of children). Because it is really hard to identify trends while factoring in skipped years and COVID, we are going to narrow in here just on Grades 3 & 4 (2022 -2024) and Grades 5-8 (2021-2024).
Here is a little context that will apply to all six snapshots:
- Remember that any score that is two grades above ending in “.9” represents the max score, like getting a “6.9” for Grade 5.
- Bear in mind, that the metric we are normally looking at when it comes to comparing a grade is either stability (if the baseline was appropriately high) or incremental growth (if the baseline was lower than desired and and the school responded with a program or intervention in response).
- In 2023 we took it in the “.1” of the school year and in all prior years in the “.2”. If we are being technical, therefore, “.9” would actually be the truest measure of growth since the time frame is “.1” less. For the purposes of this analysis, I am going round “.9” up and consider it a “year’s” worth of growth.
Here are the grade snapshots:
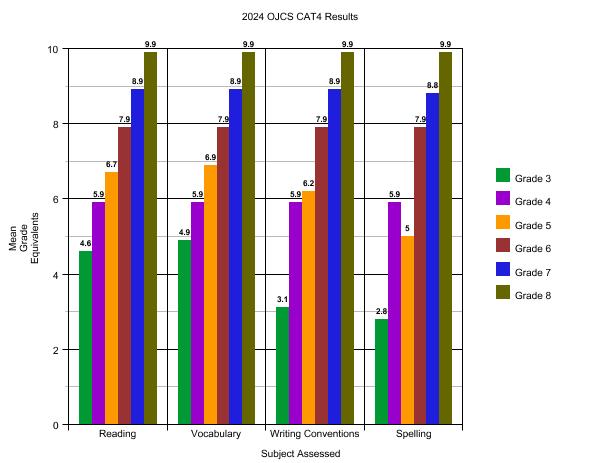
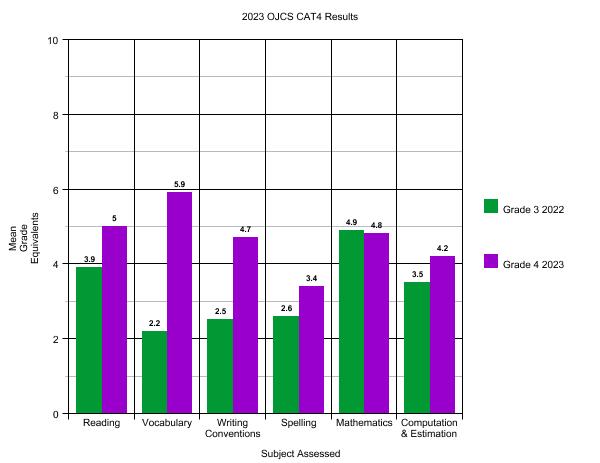
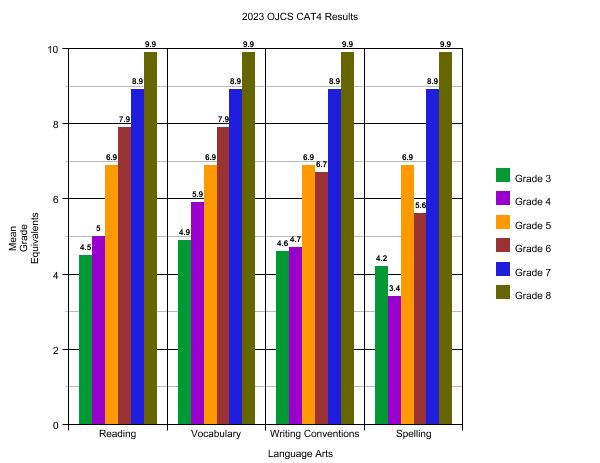
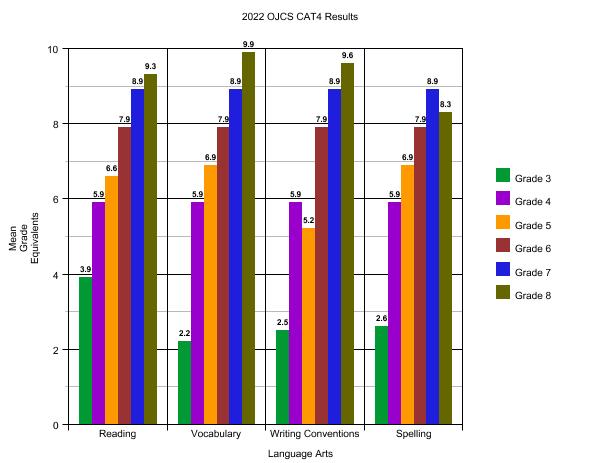
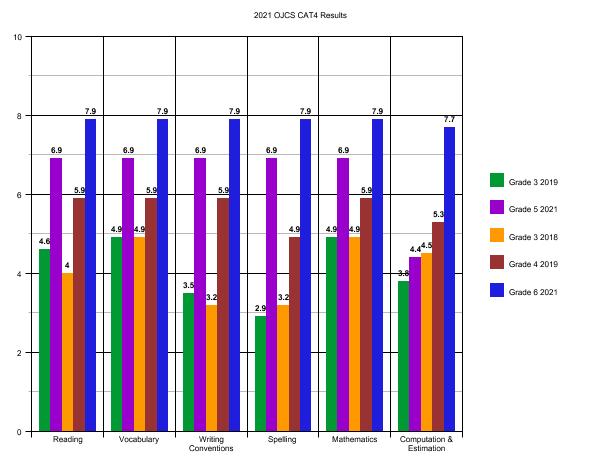
What can we learn from Grade 3 over time?
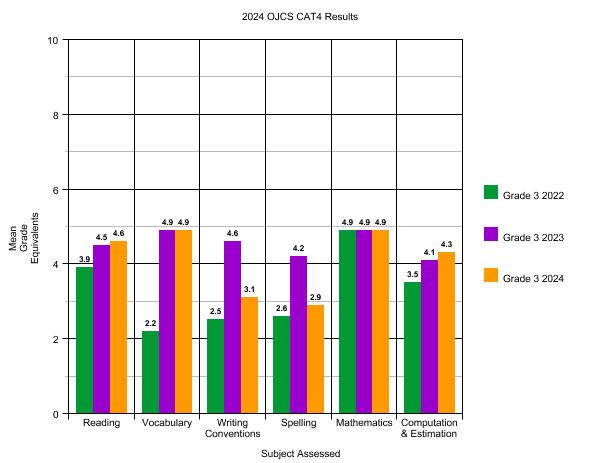
- I don’t want to have to repeat this each time, but please remember these are different children taking this test in Grade 3. Grade 3 is also the first year we take the test and so there is only so much to learn here.
- One assumes that with a stable teaching team (not always true) that, over time, the scores would gently curve upwards towards a maximum (here “4.9”), however, again, considering these are completely different children, the growth really is more visible in Part II’s analysis.
- When I look at this, I say, that “Writing Conventions” and “Spelling” are the areas for focus. In a few more years, we’ll know better what is the blip and what is the trend, but even though we are essentially at “grade level,” the floor we seek is set a bit higher. This will be a place for Grade 3 to use the data to drive curricular and programmatic decisions.
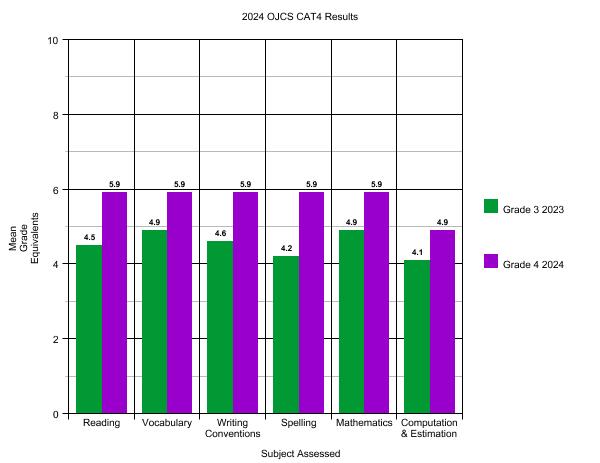
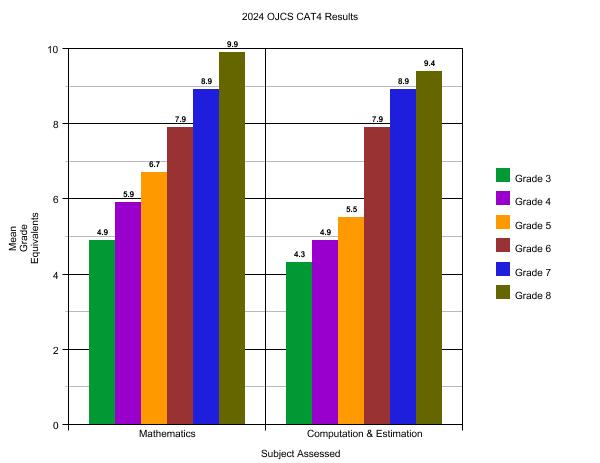
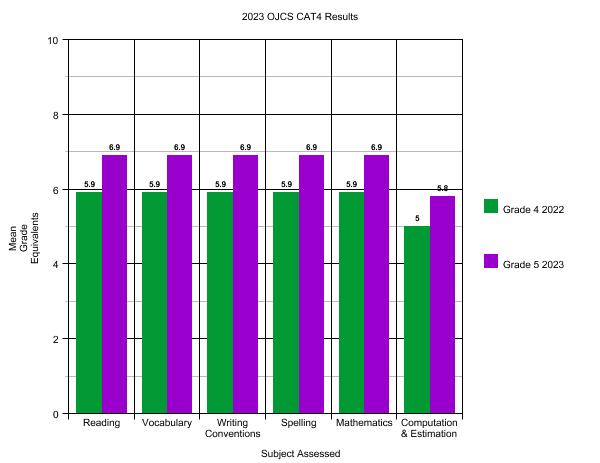
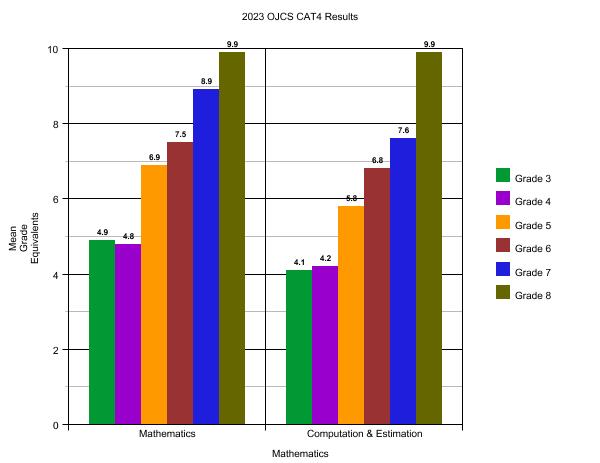
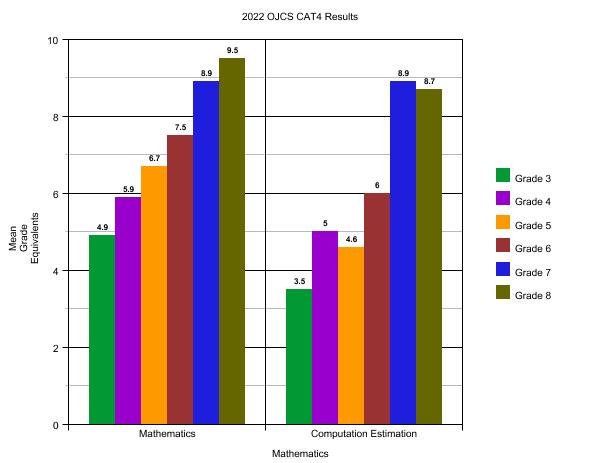
What can we learn from Grade 4 over time?
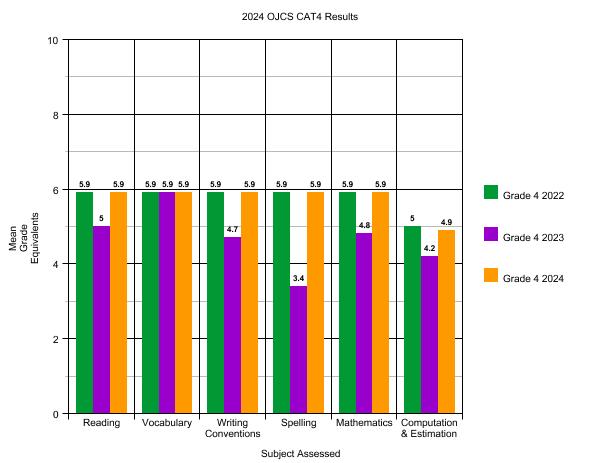
- Here we see a bit of the converse of the one above…if 2023 is the blip, then these are overall excellent scores.
- Again, if there was a place to look – even if all years fall at or above grade level – it would be Computation & Estimation.
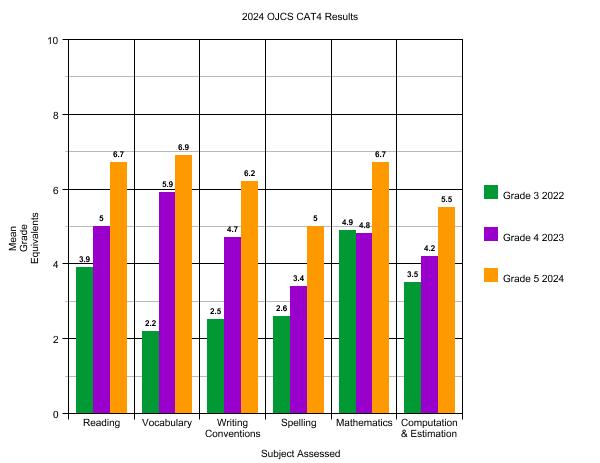
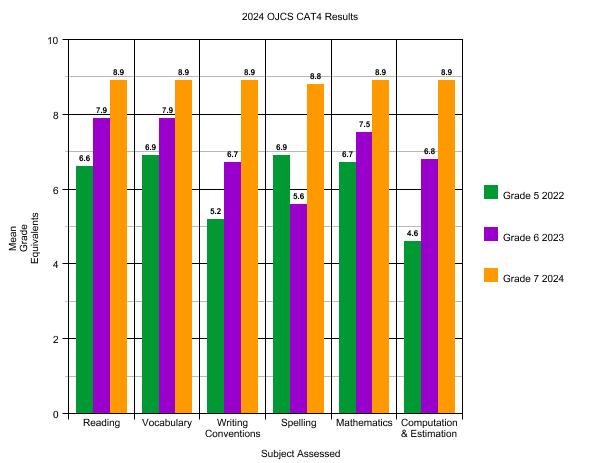
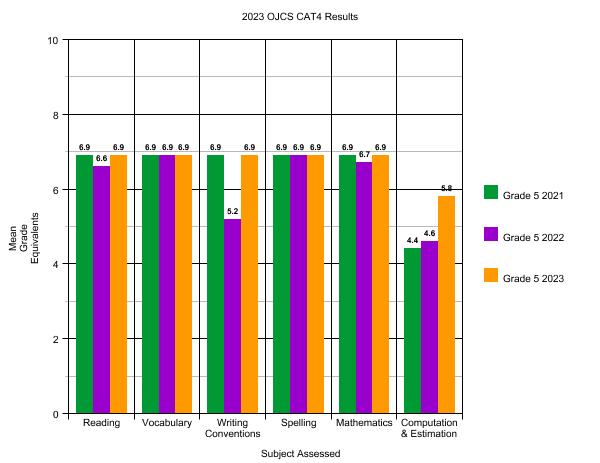
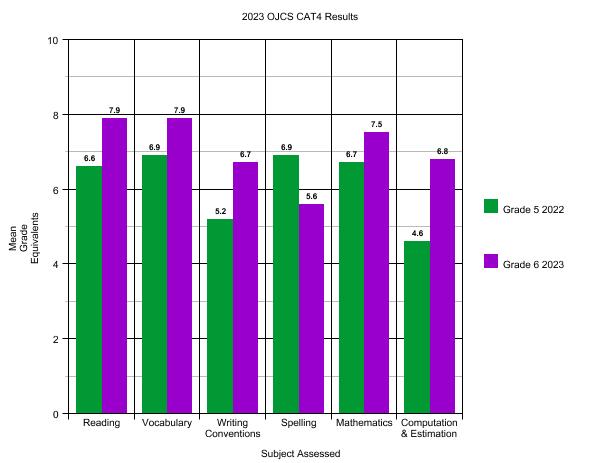
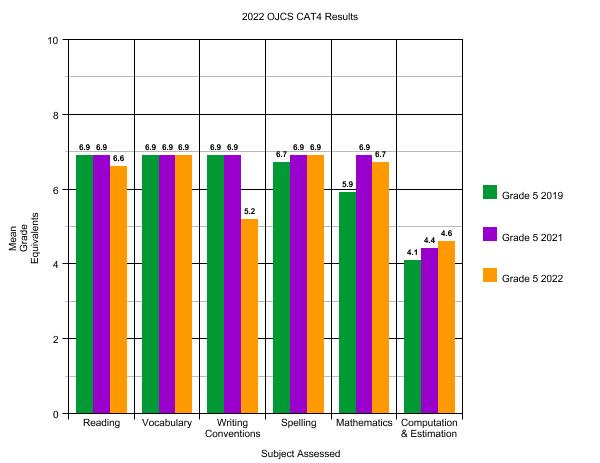
What can we learn from Grade 5 over (more) time?
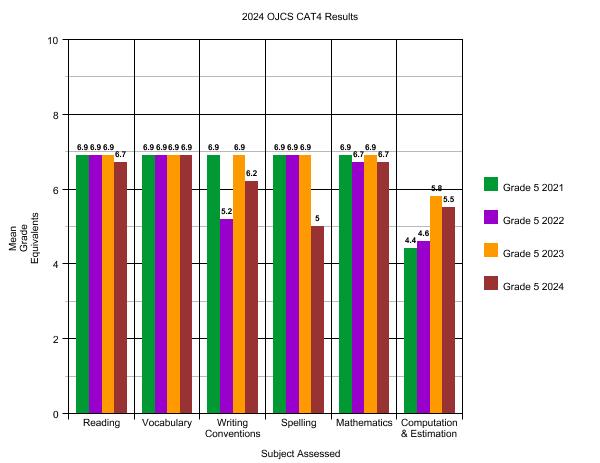
- Again, we are looking at Grade 5. So even the dips (Grade 5 2024 Spelling) are actually at grade level.
- Writing Conventions are a bit hard to tease out (different children), but worth paying attention to.
- And, again, Computation & Estimation has settled higher, but with our hopes for two grades above, still has room to grow.
Now let’s see how the transition to Middle School impacts things.
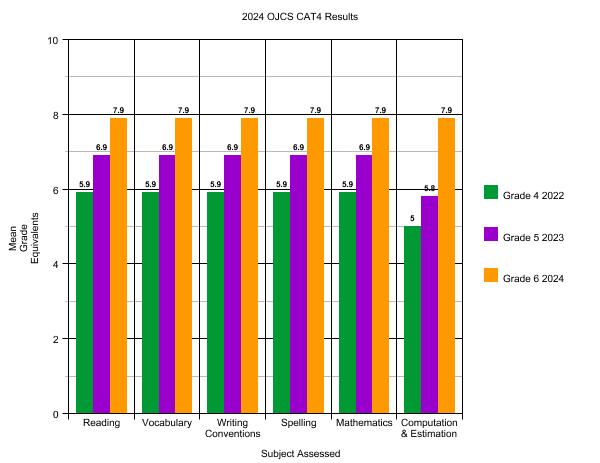
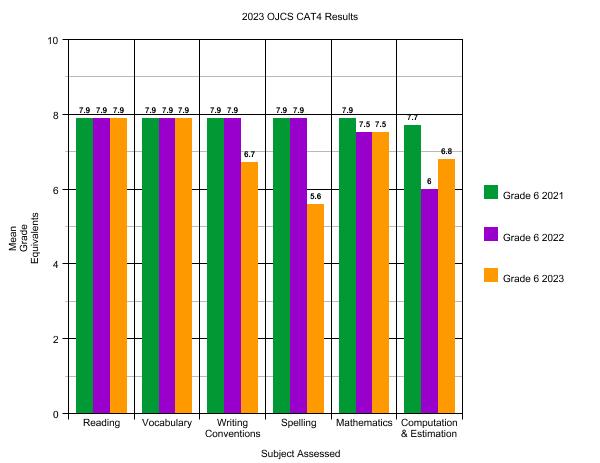
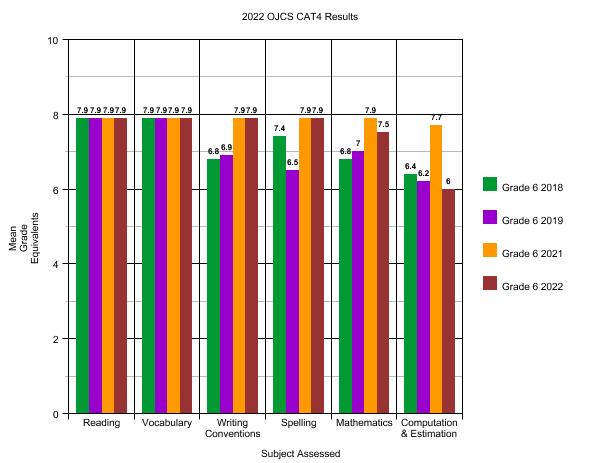
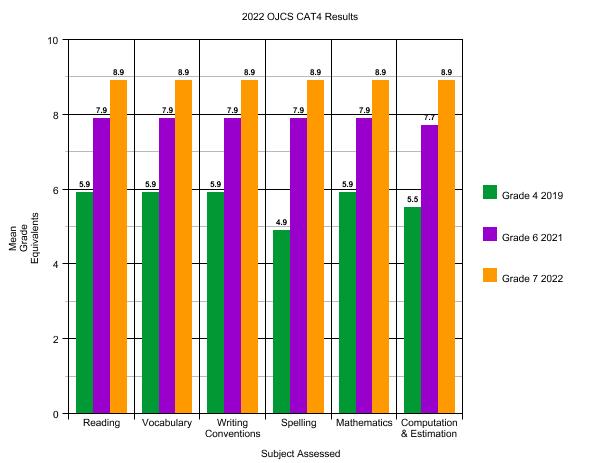
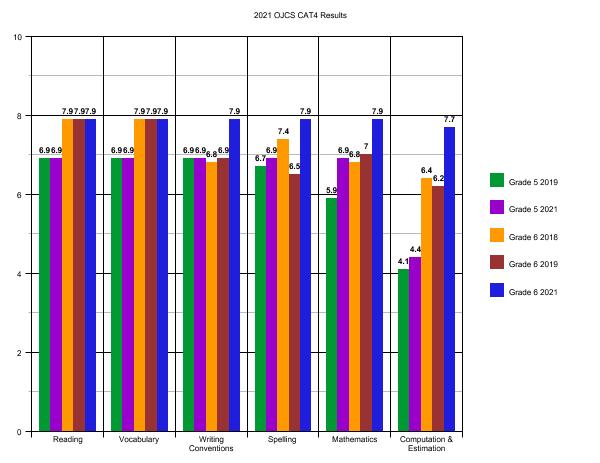
What can we learn from Grade 6 over time?
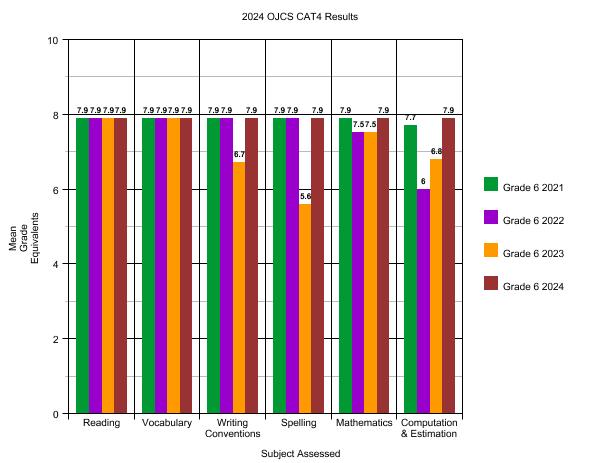
It is worth asking if there one can see the difference when we shift from Lower School (with there being a General Studies Teacher) to Middle School (with separate Language Arts and Math Teachers). Because even though this is four year’s worth of different children in Grade 7, other than a couple of blips, these are all uniformly excellent scores at or near the max.
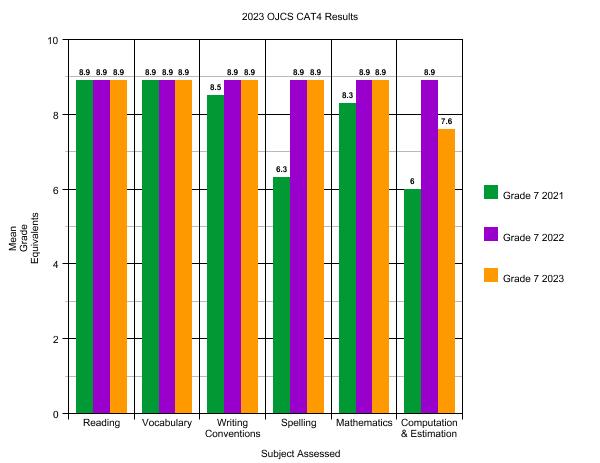
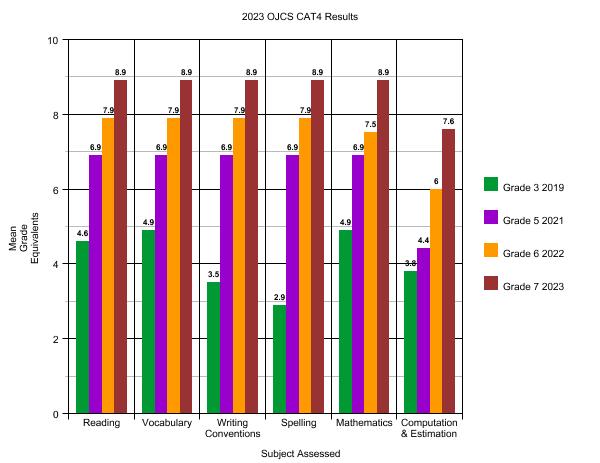
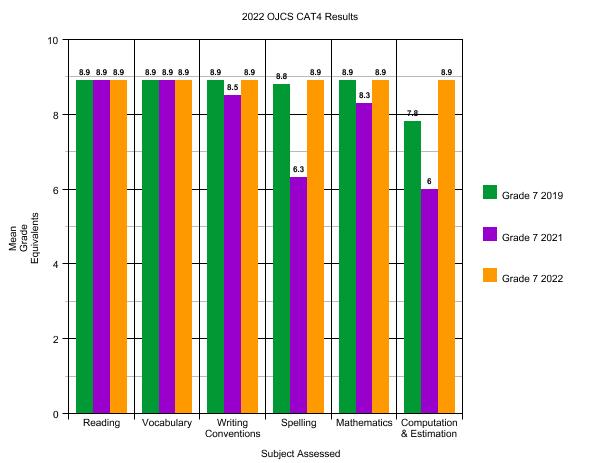
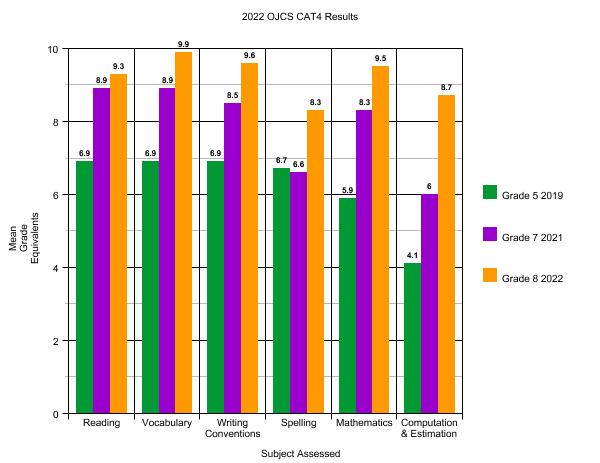
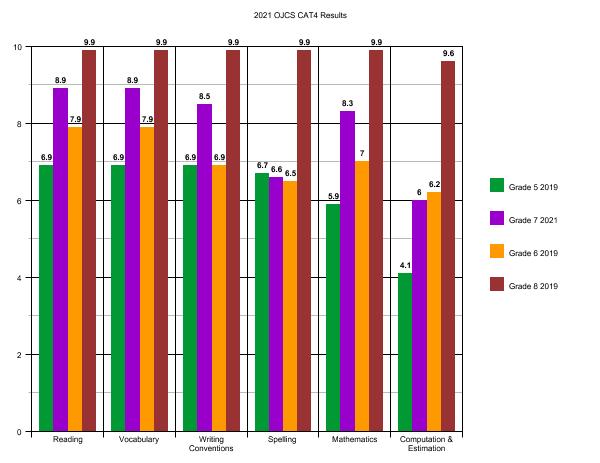
What can we learn from Grade 7 over time?
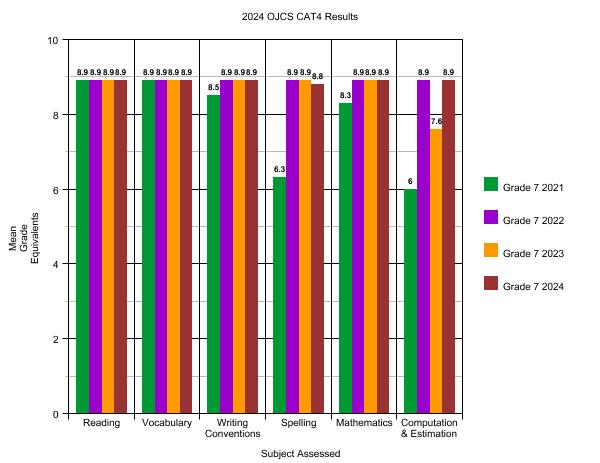
This is essentially the same story as Grade 6, which reinforces the above.
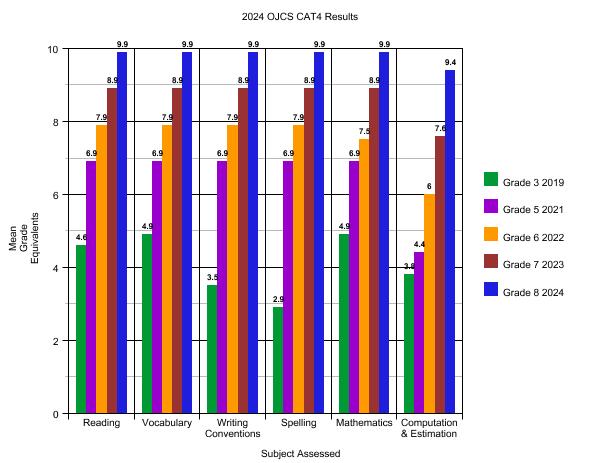
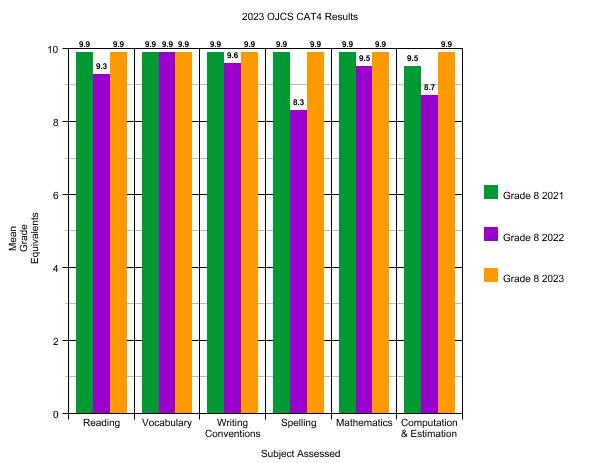
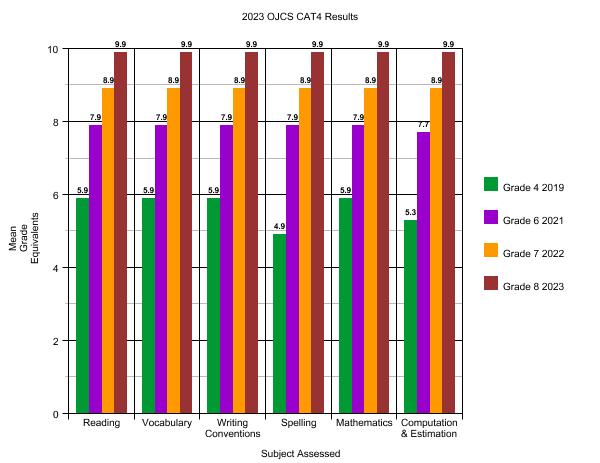
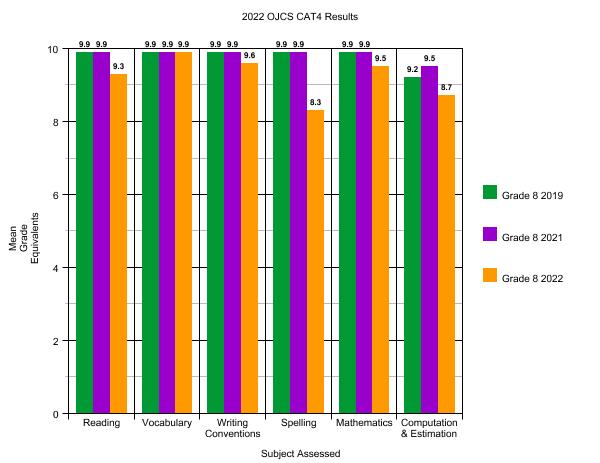
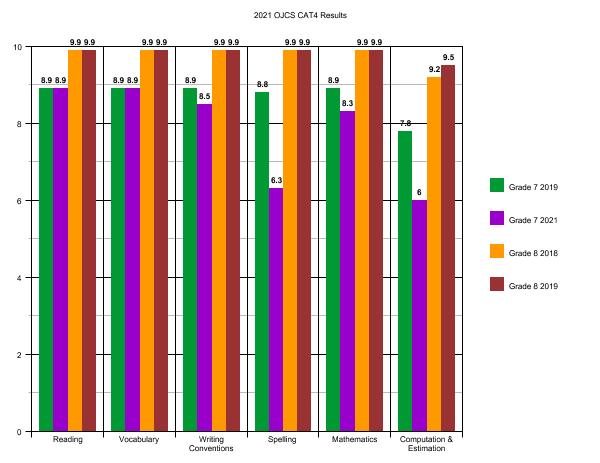
What can we learn from Grade 8 over time?
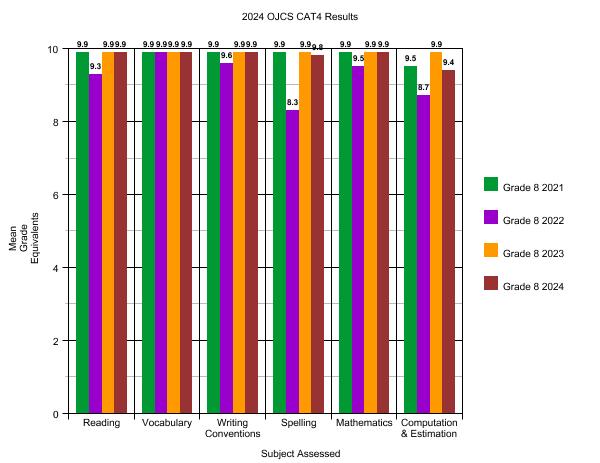
The same.
Biggest takeaway? It is probably overdue for OJCS to take a hard look at Spelling, but other than that a snapshot of where all our students are by their last year at OJCS has to reassuring for our current parents and, hopefully, inspiring to all those who are considering how OJCS prepares its graduates for high school success.

The bottom line is that our graduates – year after year – successfully place into the high school programs of their choice. Each one had a different ceiling – they are all different – but working with them, their families and their teachers, we successfully transitioned them all to the schools (private and public) and programs (IB, Gifted, French Immersion, Arts, etc.) that they qualified for.
And now again this year, with all the qualifications and caveats, our CAT*4 scores continue to demonstrate excellence. Excellence within the grades and between them.
Not a bad place to be as we enter the 2025-2026 enrollment season…