

As committed to “transparency” as I am, I find myself growing more and more ambivalent each year about how to best facilitate an appropriate conversation about why our school engages in standardized testing (which for us, like many independent schools in Canada, is the CAT4), what the results mean (and what they don’t mean), how it impacts the way in which we think about “curriculum” and, ultimately, what the connection is between a student’s individual results and our school’s personalized learning plan for that student. It is not news that education is a field in which pendulums tend to wildly swing back and forth as new research is brought to light. We are always living in that moment and it has always been my preference to aim towards pragmatism. Everything new isn’t always better and, yet, sometimes it is. Sometimes you know right away and sometimes it takes years.
I have already taken a blog post that I used to push out in one giant sea of words, and over time broke it into two ,and now three parts, because even I don’t want to read a 3,000 word post. But, truthfully, it still doesn’t seem enough. I continue to worry that I have not done a thorough enough job providing background, research and context to justify a public-facing sharing of standardized test scores. Probably because I haven’t. [And that’s without factoring in all the COVID gaps that come along with it.]
And yet.
With the forthcoming launch of Annual Grades 9 & 12 Alumni Surveys and the opening of the admissions season for the 2023-2024 school year, it feels fair and appropriate to be as transparent as we can about how well we are (or aren’t) succeeding academically against an external set of benchmarks, even as we are still just freshly coming out facing extraordinary circumstances. That’s what “transparency” as a value and a verb looks like. We commit to sharing the data and our analysis regardless of outcome. We also do it because we know that for the overwhelming majority of our parents, excellence in secular academics is a non-negotiable, and that in a competitive marketplace with both well-regarded public schools and secular private schools, our parents deserve to see the school’s value proposition validated beyond anecdotes.
Now for the annual litany of caveats and preemptive statements…
We have not yet shared out individual reports to our parents. First our teachers have to have a chance to review the data to identify which test results fully resemble their children well enough to simply pass on, and which results require contextualization in private conversation. Those contextualizing conversations will take place in the next few weeks and, thereafter, we should be able to return all results.
There are a few things worth pointing out:
- Because of COVID, this is now only our fourth year taking this assessment at this time of year. We were in the process of expanding the range from Grades 3-8 in 2019, but we paused in 2020 and restricted last year’s testing to Grades 5-8. This means that we can only compare at the grade level from 2019’s Grades 5-8 to 2021’s Grades 5-8 to 2022’s Grades 5-8.
- And we can only compare at the cohort level from 2019’s Grades 3-5 to 2021’s Grades 5-7 to 2022’s Grades 6-8.
- This is the first year we have tested Grades 3 & 4 on this exam at this time of year.
- From this point further, assuming we continue to test in (at least) Grades 3-8 annually, we will soon have tracking data across all grades which will allow us to see if…
- The same grade scores as well or better each year.
- The same cohort grows at least a year’s worth of growth.
- The last issue is in the proper understanding of what a “grade equivalent score” really is.
Grade-equivalent scores attempt to show at what grade level and month your child is functioning. However, grade-equivalent scores are not able to show this. Let me use an example to illustrate this. In reading comprehension, your son in Grade 5 scored a 7.3 grade equivalent on his Grade 5 test. The 7 represents the grade level while the 3 represents the month. 7.3 would represent the seventh grade, third month, which is December. The reason it is the third month is because September is zero, October is one, etc. It is not true though that your son is functioning at the seventh grade level since he was never tested on seventh grade material. He was only tested on fifth grade material. He performed like a seventh grader on fifth grade material. That’s why the grade-equivalent scores should not be used to decide at what grade level a student is functioning.
Let me finish this section by being very clear: We do not believe that standardized test scores represent the only, nor surely the best, evidence for academic success. Our goal continues to be providing each student with a “floor, but no ceiling” representing each student’s maximum success. Our best outcome is still producing students who become lifelong learners.
But I also don’t want to undersell the objective evidence that shows that the work we are doing here does in fact lead to tangible success. That’s the headline, but let’s look more closely at the story. (You may wish to zoom in a bit on whatever device you are reading this on…)
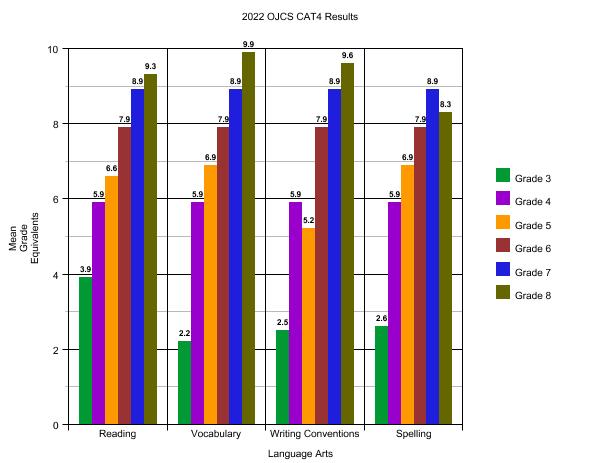
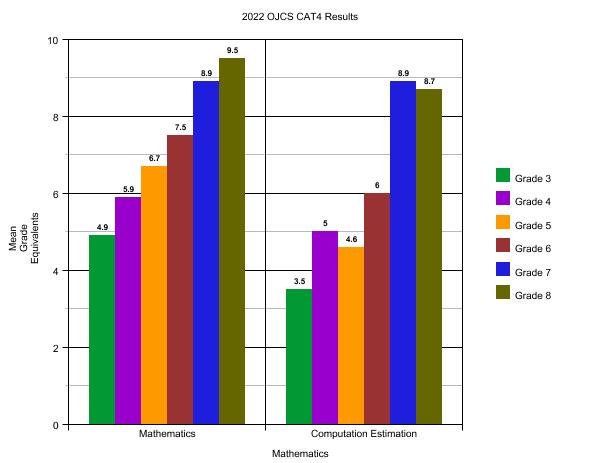
A few tips on how to read this:
- We take this exam in the “.2” of each grade-level year. That means that “at grade level” [again, please refer above to a more precise definition of “grade equivalent scores”] for any grade we are looking at would be 5.2, 6.2, 7.2, etc. For example, if you are looking at Grade 6, anything below 6.2 would constitute “below grade level” and anything above 6.2 would constitute “above grade level.”
- The maximum score for any grade is “.9” of the next year’s grade. If, for example, you are looking at Grade 8 and see a score of 9.9, on our forms it actually reads “9.9+” – the maximum score that can be recorded.
- Because of when we take this test – approximately two months into the school year – it is reasonable to assume a significant responsibility for results is attributable to the prior year’s teachers and experiences. But, of course, it is very hard to tease it out exactly, of course.
What are the key takeaways from these snapshots of the entire school?
- Looking at six different grades through six different dimensions there are only five instances out of thirty-six of scoring below grade-level: Grade 3 (Vocabulary 2.2, Writing Conventions 2.5, and Spelling 2.6), Grade 5 (Computation Estimation 4.6), and Grade 6 (Computation Estimation barely falling short at 6.0).
- I’m not quite sure what to make of Grade 3’s Language Arts scores altogether. Reading and Writing has been the most notable lagging skill for the Grade 3 cohort since their entry into Grade 2. This is in part due to disruptions to their learning through their foundation-building years in Kindergarten and Grade 1. In Grade 2, this cohort’s remediation was heavily focused on closing the gaps in reading and comprehension abilities, as developmentally this is what comes first. The remediation focus has shifted to writing at the start of Grade 3, as this is a lagging skill that was already identified prior to the CAT-4 testing. Supports and interventions have already been put in place to address this lagging skill and we have seen academic growth in these areas. To put it more simply: These are our youngest students whose early learning was the most disrupted by COVID and they have never taken a standardized test before in their lives. It will become a baseline that I imagine us jumping over quickly in the years to come – I’m inclined to toss them out as an anomaly.
- Importantly, tracing the trajectory from our 2019 results to our 2021 results to 2022’s, we can now more conclusively state that Spelling and Computation & Estimation are no longer globally lower as a school relative to the other dimensions. I will have more to say about why we believe this to be true in Parts II & III.
What stands out the most is how exceedingly well each and every grade has done in just about each and every section. In almost all cases, each and every grade is performing significantly above grade-level. This is a very encouraging set of data points.

Stay tuned next week when we begin to dive into the comparative data. “Part II” will look at the same cohort over time. “Part III” will look at the same grade (the same group of students) over time and conclude this series of posts with some additional summarizing thoughts.
A couple of reflections on the third grade scores. As a longtime educator, I am not at all surprised that their scores are lower when compared to achievement of your older students. Those taking the test for the first time are not as experienced in test taking skills. They’ll be more test savvy in coming years. They may also have been more anxious than the older students. As a teacher or parent I’d look to see how closely individual scores reflect what you are seeing in the classroom and at home.
I know of the same pattern with another grade 3 group in a public school in Toronto. Their they are assuming the cause was COVID restrictions of the past few years.