

This may seem like a very odd time to be sharing out results from this year’s standardized testing, which in our school is the CAT4. We are just finishing up our first days in this year’s most recent pivot back to distance learning and we are confident that everyone – students, parents and teachers – has more pressing concerns than a very long and detailed analysis of standardized tests that we managed to squeeze in during the in-person portion of our school year. (The post is so long that I am splitting it into two parts, and each part is still a bit lengthy.) But with our launch of Annual Grades 9 & 12 Alumni Surveys and the opening of the admissions season for the 2022-2023 school year, one might argue that there is not a better time to be more transparent about how well we are (or aren’t) succeeding academically against an external set of benchmarks while facing extraordinary circumstances.
There is a very real question about “COVID Gaps” and the obvious impacts on children and schools from the many pivots, hyflex, hybrid, masked and socially-distanced, in-person and at-home learning experiences we have all cycled through together since March of 2020. (I wrote earlier in the year about some of the non-academic COVID gaps that we are very much experiencing, all of which I imagine growing proportionate to the length of this current pivot.) And it seems logical that there should be and are academic gaps, at least at the individual student level. One might ask why we even bothered taking the CAT4 at all this year; we didn’t take it last school year for example, so it will be really hard to make meaningful apples-to-apples comparisons. So why take them? And why share the results, whatever they may be?
We did it for a few reasons…
The first and primary reason is that we are curious. Curiosity may not be a “North Star” at OJCS, but it is a value. And we are very curious to see how our standardized test scores measure up pre-COVID and post-COVID, both by grade (2019 Grade 5 v. 2021 Grade 5) and by cohort (2019 Grade 5 v. 2021 Grade 7). We would normally be looking for patterns and outliers anyway, but now we can also look for COVID impacts as well.
Why share the results? Because that’s what “transparency” as a value and a verb looks like. We commit to sharing the data and our analysis regardless of outcome because we believe in the value of transparency. We also do it because we know that for the overwhelming majority of our parents, excellence in secular academics is a non-negotiable, and that in a competitive marketplace with both well-regarded public schools and secular private schools, our parents deserve to see the school’s value proposition validated beyond anecdotes.
Now for the caveats and preemptive statements…
We have not yet shared out individual reports to our parents. First our teachers have to have a chance to review the data to identify which test results fully resemble their children well enough to simply pass on, and which results require contextualization in private conversation. Those contextualizing conversations will take place in the next few weeks and thereafter, we should be able to return all results.
There are a few things worth pointing out:
- Because of COVID, this is now only our third year taking this assessment at this time of year. We were in the process of expanding the range from Grades 3-8 in 2019, but we paused in 2020 and restricted this year’s testing to Grades 5-8. This means that we can only compare at the grade level from 2019’s Grades 5-8 to 2021’s Grades 5-8, and we can only compare at the cohort level from 2019’s Grades 3-6 to 2021’s Grades 5-8. And remember we have to take into account the missing year…this will make more sense in “Part II” (I hope). Post-COVID, we will have tracking data across all grades which will allow us to see if…
- The same grade scores as well or better each year.
- The same cohort grows at least a year’s worth of growth.
- The other issue is in the proper understanding of what a “grade equivalent score” really is.
Grade-equivalent scores attempt to show at what grade level and month your child is functioning. However, grade-equivalent scores are not able to show this. Let me use an example to illustrate this. In reading comprehension, your son in Grade 5 scored a 7.3 grade equivalent on his Grade 5 test. The 7 represents the grade level while the 3 represents the month. 7.3 would represent the seventh grade, third month, which is December. The reason it is the third month is because September is zero, October is one, etc. It is not true though that your son is functioning at the seventh grade level since he was never tested on seventh grade material. He was only tested on fifth grade material. He performed like a seventh grader on fifth grade material. That’s why the grade-equivalent scores should not be used to decide at what grade level a student is functioning.
Let me finish this section by being very clear: We do not believe that standardized test scores represent the only, nor surely the best, evidence for academic success. Our goal continues to be providing each student with a “floor, but no ceiling” representing each student’s maximum success. Our best outcome is still producing students who become lifelong learners.
But I also don’t want to undersell the objective evidence that shows that the work we are doing here does in fact lead to tangible success. That’s the headline, but let’s look more closely at the story. (You may wish to zoom (no pun intended!) in a bit on whatever device you are reading this on…)
A few tips on how to read this:
- We take this exam in the “.2” of each grade-level year. That means that “at grade level” [again, please refer above to a more precise definition of “grade equivalent scores”] for any grade we are looking at would be 5.2, 6.2, 7.2, etc. For example, if you are looking at Grade 6, anything below 6.2 would constitute “below grade level” and anything above 6.2 would constitute “above grade level.”
- The maximum score for any grade is “.9” of the next year’s grade. If, for example, you are looking at Grade 8 and see a score of 9.9, on our forms it actually reads “9.9+” – the maximum score that can be recorded.
- Because of when we take this test – approximately two months into the school year – it is reasonable to assume a significant responsibility for results is attributable to the prior year’s teachers and experiences. But it is very hard to tease it out exactly, of course.
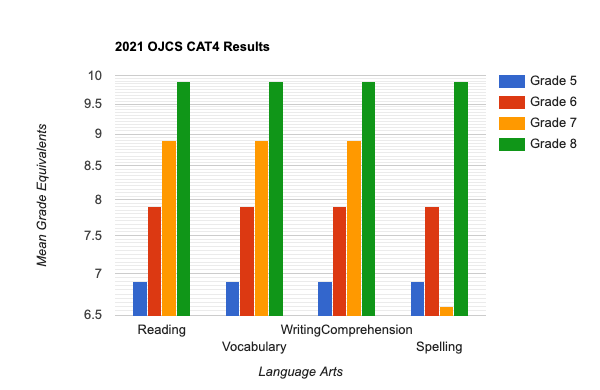
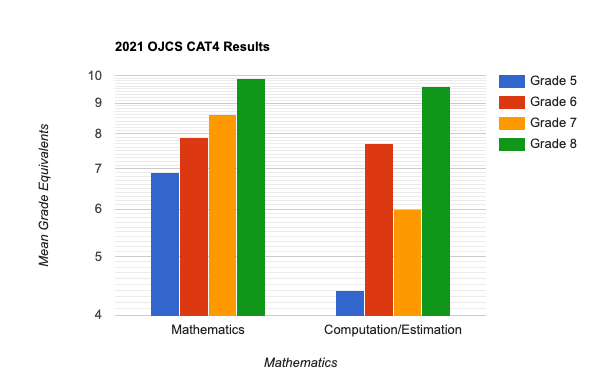
What are the key takeaways from these snapshots of the entire school?
- Looking at four different grades through six different dimensions there are only three instances (out of twenty-four) of scoring below grade-level: Grade 5 in Computation & Estimation (4.4), and Grade 7 in Spelling (6.6) and Computation & Estimation (6.0).
- Interestingly, compared to our 2019 results, those two dimensions – Spelling and Computation & Estimation are no longer globally lower as a school relative to the other dimensions. In 2019, for example “Spelling” was a dimension where we scored lower as a school (even if when above grade level) relative to the other dimensions. In 2021, we don’t see “Spelling” as scoring globally below. (That’s a good thing!) [We also have some anecdotal evidence that a fair number of students in Grade 7 may not have finished the Computation section, leaving a fair number of questions blank – in the case of this cohort, it might be more valuable to know how well they did on the questions they actually answered (which we will do).]
What stands out the most is how exceedingly well each and every grade has done in just about each and every section. In almost all cases, each and every grade is performing significantly above grade-level. This is NOT what I was expecting considering the impacts of COVID over the last two years – I was fully expecting to see at least .5 (a half-year) gap globally across the grades and subjects. This is a surprising and very encouraging set of data points.

Stay tuned for “Part II” in which we will dive into the comparative data – of both the same grade and the same cohort (the same group of students) over time – and offer some additional summarizing thoughts.