The Transparency Files: CAT4 Results (Yes, Even During COVID) Part II

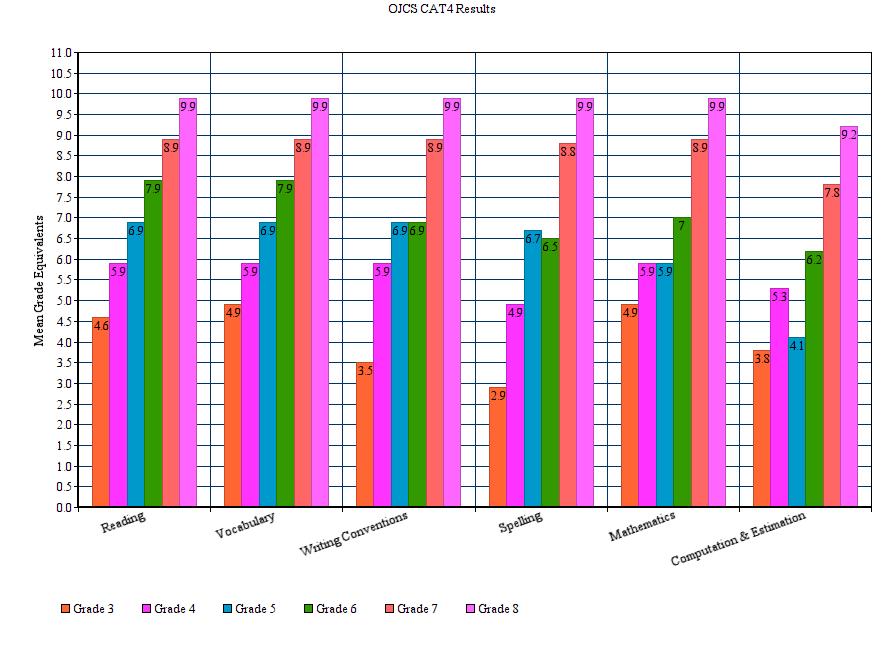
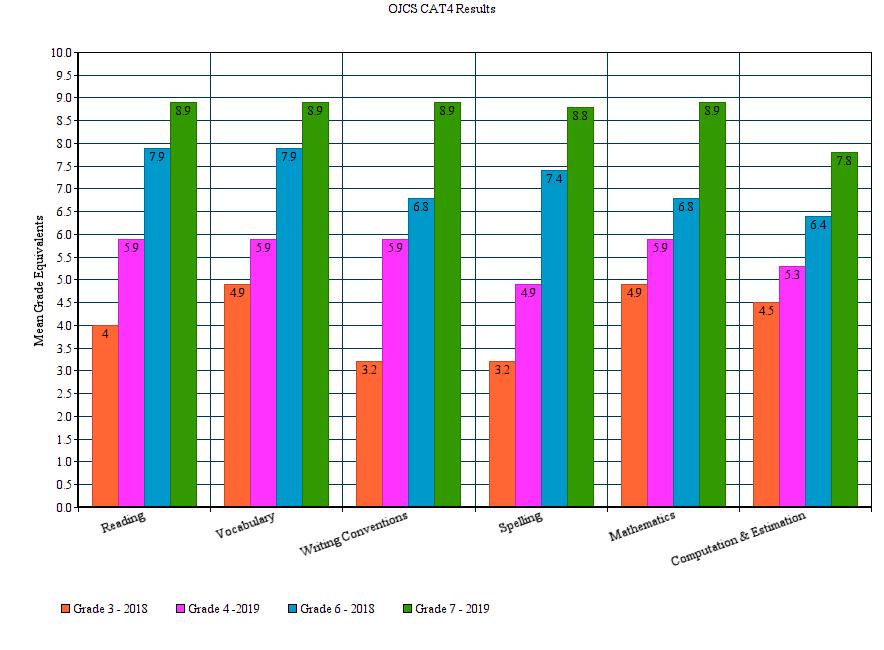
Welcome to “Part II” of our analysis of this year’s CAT4 results!  In Tuesday’s post, we provided a lot of background context and shared out the simple results of how we did this year.  Here in our second post, we are now able to begin sharing comparative data, however patchy.  It will take at least one more non-COVID year before we can accurately compare the same grade and the same cohort year after year.  But we can get a taste of it with Grades 5-8.  What you have below are snapshots of the same cohort (the same group of children) from 2019 to 2021 (with bonus data from 2018’s Grade 3):

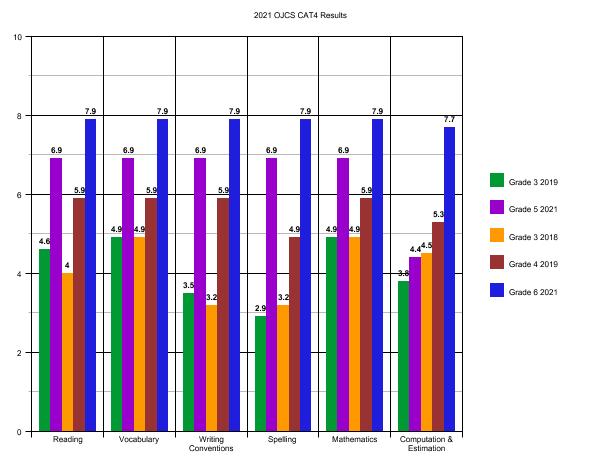
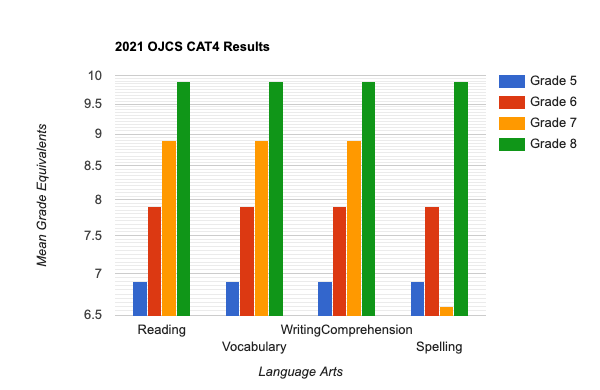
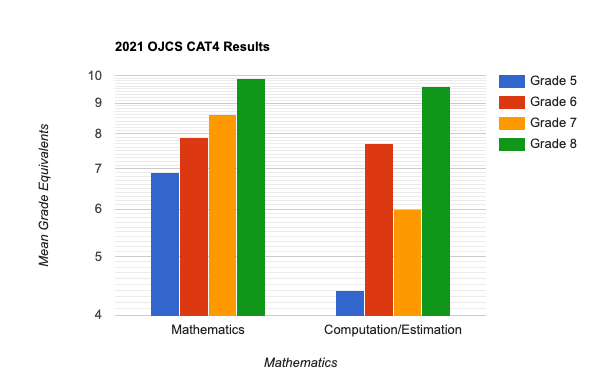
What are the key takeaways from this comparison (remembering that any score that is two grades above ending in “.9” represents the max score, like getting an “8.9” for Grade 7)?

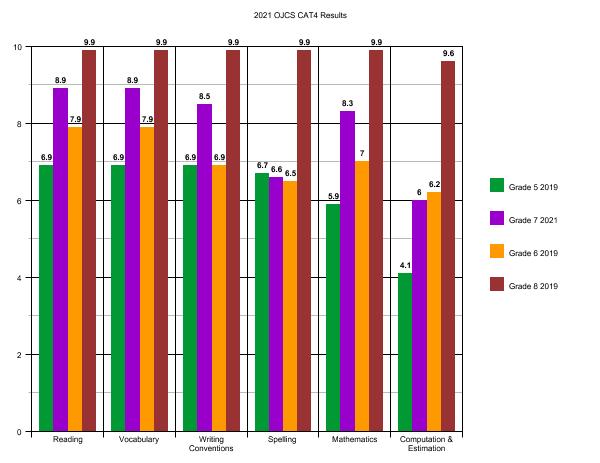
Now bear in mind, that the metric we are normally looking at when it comes to comparing a cohort over time is whether or not we see at least one full year’s growth (on average) each year – here we are looking to see two full year’s growth since we last took the test in 2019.  This would be the place one might expect to see the full measure of COVID’s impact – these are the two years of COVID between the two tests.  However, for all four cohorts in all categories save two (2019 Grade 3 to 2021 Grade 5 “Computation & Estimation” and 2019 Grade 5 to 2021 Grade 7 “Spelling”) you see at least two full year’s growth (technically 2019 Grade 5 to 2021 Grade 7 “Computation & Estimation” was just shy) and in may cases you see more than two full year’s growth.

I’m going to say that again.

During the time of the pandemic, with all the pivots back and forth, all the many challenges of both hyflex and at-home learning, all the prolonged absences by many students (and teachers), with all the social and emotional stress and anxiety, with everything we know about what COVID has been doing to children and to families, in almost each category that we tested our students in Grades 5-8 – spending no time or energy preparing for the exams and with diverse and inclusive classes – in 22 of 24 domains we see at least the pre-COVID expected two-year gain, and in many cases we see more than two full year’s growth.

As was true with our overall scores, I was expecting to see a significant number of gaps for all the reasons I just described, but surprisingly and encouragingly, that is not what the data yields.

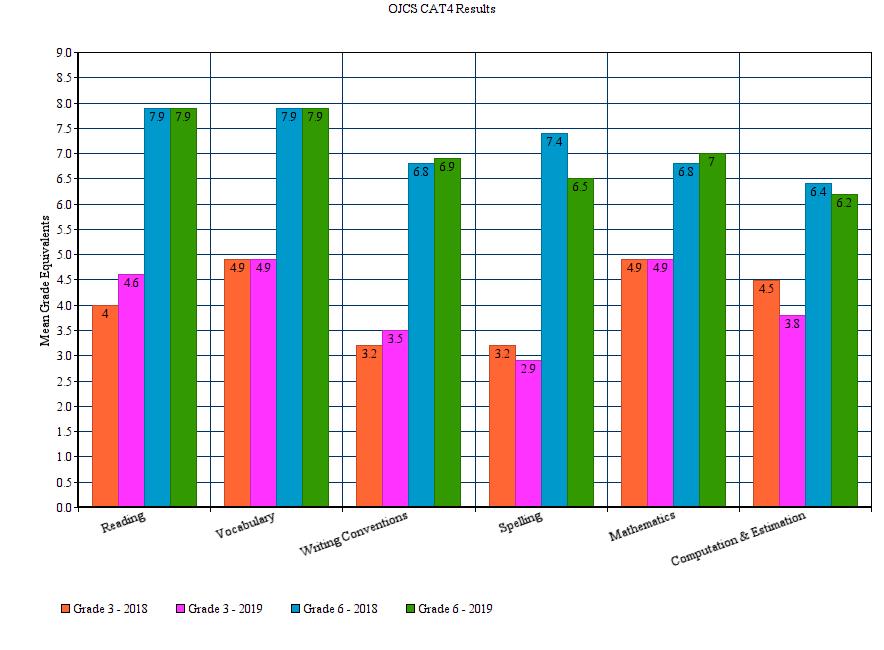
Let’s look at one more set data points.  We can also get a taste of how the same grade performs from one year to the next as well.  Again, we only have Grades 5-8 to look at with (with a bonus 2018 Grade 6):

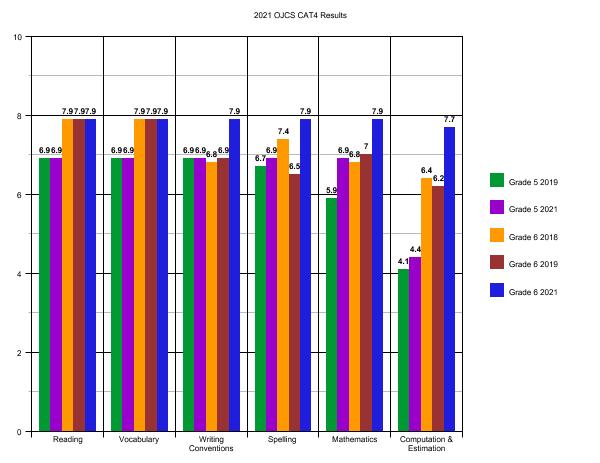
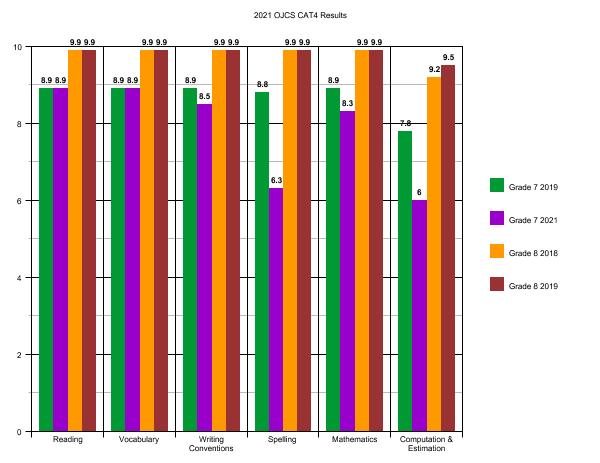
Now, remember that these scores represent a completely different group of children, so it is not unusual or surprising to see variances. Teachers can only grow students from the place they received them and it is that annual growth that we are concerned with.  But over time you are looking for patterns.  Ideally each domain settles in at least a full grade above with slight fluctuations from year to year depending on that year’s particular constellation of students.  Even-better would be to see slight ticks up each year as a result of new ideas, new pedagogies, new programs, etc.  And that is actually where much of the story currently is.

In the places where we aren’t quite where we want to be, we still have work to do.  If with additional data we come to believe that Spelling or Computation & Estimation are institutional weaknesses, we will want to know whether they are weakness in every grade or do they dip in certain grades.  Between COVID and gaps in testing, we simply have no way to conclude much more than we have already laid out.  But in another year or so, we will be able to plot the trajectory of both cohorts (the same students) and grades over time to see what additional stories they tell.

To try sum up both posts, we have a lot to be proud of in our standardized test scores.  We have two areas (Spelling and Computation & Estimation) to prioritize in two grades (Five & Seven).  With regard to Spelling, it is interesting to note that when we flagged it in 2019 as a more global concern, we began providing professional growth opportunities for language arts teachers in our school on Structured Word Inquiry.  The sample sizes are too small to make grand conclusions, but it is possible that those interventions help explain why Spelling is no longer a global concern, although we do need to pay attention to where and why it is lagging where it is.  With regard to Computation & Estimation, we will – like with Spelling – have an internal conversation which may lead to PD for Math Teachers.

This fits in with the work we began on our November PD Day which focused on “Data-Driven Decision Making”.  The Math and Language Arts Teachers in Grades 5-8 will be meeting to go through CAT4 results in greater detail, with an eye towards what kinds of interventions are needed now – in this year – to fill any gaps (both for individual students and for grades); and how might we adapt about our long-term planning to ensure we are best meeting needs.

The bottom line is that our graduates – year after year – successfully place into the high school programs of their choice.  Each one had a different ceiling – they are all different – but working with them, their families and their teachers, we successfully transitioned them all to the schools (private and public) and programs (IB, Gifted, French Immersion, Arts, etc.) that they qualified for.

And now again this year, despite all the qualifications and caveats, and in the face of the most challenging set of educational circumstances any generation of students and teachers have faced, our CAT4 scores continue to demonstrate excellence.  Excellence within the grades and between them.

Not a bad place to be as we prepare to open the 2022-2023 enrollment season…

The Transparency Files: CAT4 Results (Yes, Even During COVID) Part I

This may seem like a very odd time to be sharing out results from this year’s standardized testing, which in our school is the CAT4.  We are just finishing up our first days in this year’s most recent pivot back to distance learning and we are confident that everyone – students, parents and teachers – has more pressing concerns than a very long and detailed analysis of standardized tests that we managed to squeeze in during the in-person portion of our school year.  (The post is so long that I am splitting it into two parts, and each part is still a bit lengthy.)  But with our launch of Annual Grades 9 & 12 Alumni Surveys and the opening of the admissions season for the 2022-2023 school year, one might argue that there is not a better time to be more transparent about how well we are (or aren’t) succeeding academically against an external set of benchmarks while facing extraordinary circumstances.

There is a very real question about “COVID Gaps” and the obvious impacts on children and schools from the many pivots, hyflex, hybrid, masked and socially-distanced, in-person and at-home learning experiences we have all cycled through together since March of 2020.  (I wrote earlier in the year about some of the non-academic COVID gaps that we are very much experiencing, all of which I imagine growing proportionate to the length of this current pivot.)  And it seems logical that there should be and are academic gaps, at least at the individual student level.  One might ask why we even bothered taking the CAT4 at all this year; we didn’t take it last school year for example, so it will be really hard to make meaningful apples-to-apples comparisons.  So why take them?  And why share the results, whatever they may be?

We did it for a few reasons…

The first and primary reason is that we are curious.  Curiosity may not be a “North Star” at OJCS, but it is a value.  And we are very curious to see how our standardized test scores measure up pre-COVID and post-COVID, both by grade (2019 Grade 5 v. 2021 Grade 5) and by cohort (2019 Grade 5 v. 2021 Grade 7).  We would normally be looking for patterns and outliers anyway, but now we can also look for COVID impacts as well.

Why share the results?  Because that’s what “transparency” as a value and a verb looks like.  We commit to sharing the data and our analysis regardless of outcome because we believe in the value of transparency.  We also do it because we know that for the overwhelming majority of our parents, excellence in secular academics is a non-negotiable, and that in a competitive marketplace with both well-regarded public schools and secular private schools, our parents deserve to see the school’s value proposition validated beyond anecdotes.

Now for the caveats and preemptive statements…

We have not yet shared out individual reports to our parents.  First our teachers have to have a chance to review the data to identify which test results fully resemble their children well enough to simply pass on, and which results require contextualization in private conversation.  Those contextualizing conversations will take place in the next few weeks and thereafter, we should be able to return all results.

There are a few things worth pointing out:

  • Because of COVID, this is now only our third year taking this assessment at this time of year.  We were in the process of expanding the range from Grades 3-8 in 2019, but we paused in 2020 and restricted this year’s testing to Grades 5-8.  This means that we can only compare at the grade level from 2019’s Grades 5-8 to 2021’s Grades 5-8, and we can only compare at the cohort level from 2019’s Grades 3-6 to 2021’s Grades 5-8.  And remember we have to take into account the missing year…this will make more sense in “Part II” (I hope).  Post-COVID, we will have tracking data across all grades which will allow us to see if…
    • The same grade scores as well or better each year.
    • The same cohort grows at least a year’s worth of growth.
  • The other issue is in the proper understanding of what a “grade equivalent score” really is.

Grade-equivalent scores attempt to show at what grade level and month your child is functioning.  However, grade-equivalent scores are not able to show this.  Let me use an example to illustrate this.  In reading comprehension, your son in Grade 5 scored a 7.3 grade equivalent on his Grade 5 test. The 7 represents the grade level while the 3 represents the month. 7.3 would represent the seventh grade, third month, which is December.  The reason it is the third month is because September is zero, October is one, etc.  It is not true though that your son is functioning at the seventh grade level since he was never tested on seventh grade material.  He was only tested on fifth grade material.  He performed like a seventh grader on fifth grade material.  That’s why the grade-equivalent scores should not be used to decide at what grade level a student is functioning.

Let me finish this section by being very clear: We do not believe that standardized test scores represent the only, nor surely the best, evidence for academic success.  Our goal continues to be providing each student with a “floor, but no ceiling” representing each student’s maximum success.  Our best outcome is still producing students who become lifelong learners.

But I also don’t want to undersell the objective evidence that shows that the work we are doing here does in fact lead to tangible success.  That’s the headline, but let’s look more closely at the story.  (You may wish to zoom (no pun intended!) in a bit on whatever device you are reading this on…)

A few tips on how to read this:

  • We take this exam in the “.2” of each grade-level year.  That means that “at grade level” [again, please refer above to a more precise definition of “grade equivalent scores”] for any grade we are looking at would be 5.2, 6.2, 7.2, etc.  For example, if you are looking at Grade 6, anything below 6.2 would constitute “below grade level” and anything above 6.2 would constitute “above grade level.”
  • The maximum score for any grade is “.9” of the next year’s grade.  If, for example, you are looking at Grade 8 and see a score of 9.9, on our forms it actually reads “9.9+” – the maximum score that can be recorded.
  • Because of when we take this test – approximately two months into the school year – it is reasonable to assume a significant responsibility for results is attributable to the prior year’s teachers and experiences.  But it is very hard to tease it out exactly, of course.

What are the key takeaways from these snapshots of the entire school?

  • Looking at four different grades through six different dimensions there are only three instances (out of twenty-four) of scoring below grade-level: Grade 5 in Computation & Estimation (4.4), and Grade 7 in Spelling (6.6) and Computation & Estimation (6.0).
  • Interestingly, compared to our 2019 results, those two dimensions – Spelling and Computation & Estimation are no longer globally lower as a school relative to the other dimensions.  In 2019, for example “Spelling” was a dimension where we scored lower as a school (even if when above grade level) relative to the other dimensions.  In 2021, we don’t see “Spelling” as scoring globally below.  (That’s a good thing!)  [We also have some anecdotal evidence that a fair number of students in Grade 7 may not have finished the Computation section, leaving a fair number of questions blank – in the case of this cohort, it might be more valuable to know how well they did on the questions they actually answered (which we will do).]

What stands out the most is how exceedingly well each and every grade has done in just about each and every section.  In almost all cases, each and every grade is performing significantly above grade-level.  This is NOT what I was expecting considering the impacts of COVID over the last two years – I was fully expecting to see at least .5 (a half-year) gap globally across the grades and subjects.  This is a surprising and very encouraging set of data points.

Stay tuned for “Part II” in which we will dive into the comparative data – of both the same grade and the same cohort (the same group of students) over time – and offer some additional summarizing thoughts.

The Transparency Files: CAT4 Results

As apparently is my new annual tradition, I again in the lull between parent-teacher conferences reviewed and analyzed our CAT4 results.  [I strongly encourage you to reread (or read for the first time) our philosophy on test-taking and how we both share the tests with parents and utilize the data in our decision-making.]  We provided our teachers with the data they need to better understand their students and to identify which test results fully resemble their children well enough to simply pass on and which results require contextualization in private conversation.  Those contextualizing conversations took place during conferences and, thus, we should be able to return all results to parents next week.

Before we get to the results, there are a few things worth pointing out:

  • This is now our second year taking this assessment at this time of year. However, we expanded our testing from last year’s Grades 3, 6 & 8 to this year’s Grades 3 – 8.  This means that although we now have “apples to apples” data, we can only track two of our grades (current Grades 4 & 7) from last year to this one.  Next year, we will have such tracking data across most grades which will allow us to see if…
    • The same grade scores as well or better each year.
    • The same class grows at least a year’s worth of growth.
  • The other issue is in the proper understanding of what a “grade equivalent score” really is.

Grade-equivalent scores attempt to show at what grade level and month your child is functioning.  However, grade-equivalent scores are not able to show this.  Let me use an example to illustrate this.  In reading comprehension, your son in Grade 5 scored a 7.3 grade equivalent on his Grade 5 test. The 7 represents the grade level while the 3 represents the month. 7.3 would represent the seventh grade, third month, which is December.  The reason it is the third month is because September is zero, October is one, etc.  It is not true though that your son is functioning at the seventh grade level since he was never tested on seventh grade material.  He was only tested on fifth grade material.  He performed like a seventh grader on fifth grade material.  That’s why the grade-equivalent scores should not be used to decide at what grade level a student is functioning.

We do not believe that standardized test scores represent the only, nor surely the best, evidence for academic success.  Our goal continues to be providing each student with a “floor, but no ceiling” representing each student’s maximum success.  Our best outcome is still producing students who become lifelong learners.

But I also don’t want to undersell the objective evidence that shows that the work we are doing here does in fact lead to tangible success!

That’s the headline…let’s look more closely at the story.  (You may wish to zoom in a bit on whatever device you are reading this on…)

A few tips on how to read this:

  • We took this exam in the “.2” of each grade-level year.  That means that “at grade level” [again, please refer above to a more precise definition of “grade equivalent scores”] for any grade we are looking at would be 3.2, 4.2, 5.2, etc.  For example, if you are looking at Grade 6, anything below 6.2 would constitute “below grade level” and anything above 6.2 would constitute “above grade level.”
  • The maximum score for any grade is “.9” of the next year’s grade.  If, for example, you are looking at Grade 8 and see a score of 9.9, on our forms it actually reads “9.9+” – the maximum score that can be recorded.
  • Because of when we take this test – approximately two months into the school year – it is reasonable to assume a significant responsibility for results is attributable to the prior year’s teachers and experiences.  It is very hard to tease it out exactly, of course.

What are the key takeaways from this snapshot of the entire school?

  • Looking at six different grades through six different dimensions there are only two instances of scoring below grade-level: Grade 3 in Spelling (2.9) and Grade 5 in Computation & Estimation (4.1).
  • Relatedly, those two dimensions  – Spelling and Computation & Estimation – are where we score the lowest as a school (even if every other grade is at or above grade level) relative to the other dimensions.
  • What stands out the most is how exceedingly well each and every grade has done in just about each and every section.  In almost all cases, each and every grade is performing significantly above grade-level.

In addition to the overall snapshot, we are now able to begin sharing comparative data.  It will take one more year before we can accurately compare the same grade and the same class year after year.  But we can get a taste of it with Grades 3 & 6.  What you have below is a snapshot of the same class (the same group of children) from last year to this:

What are the key takeaways from this comparison?

For both classes in all categories save one (Grade 3 to 4 “Computation & Estimation”) you see at least a full year’s growth and in many cases you see more than a full year’s growth.  (The one that fell short only showed 8 months of growth.  And it comes in the category we have already recognized as being a weak spot.)

Let’s look at one more data point.  We can also get a taste of how the same grade performs from one year to the next as well.  Again, we only have Grades 3 & 6 to examine:

Now, remember that this represents a completely different group of children, so it is not unusual or surprising to see variances.  Teachers can only grow students from the place they received them and it is that annual growth that we are concerned with.  But over time you are looking for patterns.  If we believe that Spelling is a weakness, we will want to know whether it is a weakness in every grade or does it dip in certain grades.  We have no way to know that or much else new from the above graph. It simply confirms what we presently know.  But in another year or so, we will be able to plot the trajectory of both classes (the same students) and grades over time to see what additional stories they tell.

To sum up, we have a lot to be proud of in our standardized test scores. We have two areas to investigate: Spelling and Computation.  With regard to Spelling, since we noted this as a weakness last year we had already scheduled PD for our faculty.  It just so happens that we are holding a session on “Structured Word Inquiry” for our Language Arts Teachers on Monday!  With that and other efforts we would expect to see those numbers tick up next year.  With regard to Computation, we will – like with Spelling – have an internal conversation which may lead to PD for Math Teachers.  These are examples of how we use data to increase performance.

The bottom line is that our graduates successfully place into the high school programs of their choice.  Each one had a different ceiling – they are all different – but working with them, their families and their teachers, we successfully transitioned them all to the schools (private and public) and programs (IB, Gifted, French Immersion, Arts, etc.) that they qualified for.

And now each year, despite all the qualifications and caveats, our CAT4 scores continue to demonstrate excellence.  Excellence within the grades and between them. And let’s be clear, this academic excellence comes with an inclusive admissions process.

Despite our focus on individual growth, our average growth continues to significantly outpace national percentiles and grade equivalency scores.  Does investing in reflective practices (like blogging) lead to achievement ?  Does being an innovative learning pioneer translate into high academic success?

Two years in a row may not be conclusive, but it may be heading towards it!

NOT Preparing for the CAT4 – How OJCS Thinks About Standardized Testing

From November 5th – 7th, students at the Ottawa Jewish Community School in Grades 3 – 8 will be writing the Fourth Edition of the Canadian Achievement Tests (CAT4).  The purpose of this test is to inform instruction and programming for the 2019-202o school year, and to measure our students’ growth over time.  

  • If this is the first time you are visiting this topic on my blog, I encourage you to read my post on our philosophy of standardized test-taking.
  • If you are curious about how we share the results of our standardized test-taking (and what those results have been), I encourage you to read that post as well.

What’s new for 2019-2020?

We have gone from offering the exam in Grades 3, 6, and 8 to Grades 3 – 8 in order to ensure that the data is actionable on all four levels – that of the individual student (is there something to note about how Jonny did in Mathematics from last year to this year?), individual classes (is there something to note about how Grade 5 scored in Spelling compared to when they were in Grade 4?), grades (is there something to note about how Grade 3 performed in Reading  this year when compared to how Grade 3 did last year?), and the school as a whole (how does OJCS do in Vocabulary across the board?).  Without testing the same students in the same subjects at the same time of year on an annual basis, we would not be able to notice, track or respond to meaningful patterns.

Reminder:

Standardized tests in schools that do not explicitly teach to the test nor use curriculum specifically created to succeed on the tests – like ours – are very valuable snapshots.  Allow me to be overly didactic and emphasize each word: They are valuable – they are; they really do mean something.  And they are snapshots – they are not the entire picture, not by a long shot, of either the child or the school.  Only when contextualized in this way can we avoid the unnecessary anxiety that often bubbles up when results roll in.

Last year it took about six weeks to get results back, analyzed and shared out – to parents with individual results and to community with school metrics.  We hope to be in that window of time again and look forward to making full use of them to help each student and teacher continue to grow and improve.  We look forward to fruitful conversations.  And we welcome questions and feedback through whatever channels they come…

The Transparency Files: CAT*4 Results

In the lull between parent-teacher conferences, I spent my time reading and analyzing the results of this year’s CAT*4 testing.  [I strongly encourage you to reread (or read for the first time) my philosophy on test-taking and how we planned on both sharing the tests with parents and utilizing the data in our decision-making.]  We are in the process of providing our teachers with the data they need to better understand their students and to identify which test results fully resemble their children well enough to simply pass on and which results require contextualization in private conversation.

In terms of sharing out the results publicly, which I will happily do, there are a few things worth pointing out:

  • Although we do have prior years, they are not “apples to apples” enough to plot as comparison data.  This is mostly because of our decision to change our testing window and partially because we don’t have enough grades taking the test often enough.  (I have data on spring tests from two and three years ago for grades 3 & 6.)  If that changes, part of this annual analysis will consist of tracking the grades over time to see if…
    • The same grade scores as well or better each year.
    • The same class grows at least a year’s worth of growth.
  • The other issue is in the proper understanding of what a “grade equivalent score” really is.

Grade-equivalent scores attempt to show at what grade level and month your child is functioning.  However, grade-equivalent scores are not able to show this.  Let me use an example to illustrate this.  In reading comprehension, your son in Grade 5 scored a 7.3 grade equivalent on his Grade 5 test. The 7 represents the grade level while the 3 represents the month.  7.3 would represent the seventh grade, third month, which is December.  The reason it is the third month is because September is zero, October is one, etc.  It is not true though that your son is functioning at the seventh grade level since he was never tested on seventh grade material.  He was only tested on fifth grade material.  He performed like a seventh grader on fifth grade material.  That’s why the grade-equivalent scores should not be used to decide at what grade level a student is functioning.

One final caveat about why share out grade and class averages at all when so much of our focus is on personalized learning and individual growth…

Here, my thinking has been influenced by the work I was doing prior to coming to Ottawa, in my role as Executive Director of the Schechter Day School Network and then part of the transition team which helped create Prizmah.  I cannot tell you how many conversations I have had with colleagues about the different challenges Jewish day schools often have from their secular private school and high-achieving public (and/or gifted programs and in the States and/or magnet and/or charter) school neighbors.  The biggest difference comes down to a philosophy of admissions.  [Please note that although a primary audience for my blog are OJCS parents, other folk read as well, so I am including references to forms of public education that are commonly found in the States.]

Most Jewish day schools attempt to cast the widest net possible, believing it is our mission to provide a Jewish day school education to all who may wish one.  We do not, often, restrict admission to a subset of the population who score X on an admissions test and we do not, often, adjust birthday cutoffs or recommend grade repeating to maximize academic achievement. However, schools who we are most often compared to in terms of academic achievement often do one or both.  If you then factor in whether or not you exempt special needs students from the testing and whether or not you explicitly teach to the test, you may have quite an uneven playing field to say the least.

To reframe and reset the discussion:

Jewish day schools have an inclusive admissions policy, but are expected to compete equally with elite private and high-achieving public (and gifted and, in the States, magnet and charter and suburban public) schools who have exclusive admissions policies or homogeneous populations.

So, in light of all of that – if a Jewish day school with an inclusive admissions policy, a non-exempted special needs population, and a commitment to “not teach to the test” – if that kind of school could demonstrate that it was achieving secular academic excellence on par with elite schools; well to me that would be news worth sharing.

So with all those caveats in mind, in the spirit of full transparency, and with the attitude that all data is valuable data, allow me to present this year’s results:

The bottom line of this graphic is that each grade in the Ottawa Jewish Community School scored, with a few exceptions, at a mean grade equivalent a full year higher than their current grade.  There are a few (Grade 3 Writing, Grade 3 Spelling, Grade 6 Writing, Grade 6 Spelling and Grade 6 Computation) that are closer to their current grade.  [Part of our ongoing analysis and annual comparison would be to learn more about our current spelling and writing outcomes.  Part of our deeper investigation is whether there is a way to layer on standardized French and possibly Hebrew tests to learn more about those important outcomes.]  There are a lot of grades/topics whose averages are significantly higher than that, but let the boldface sink in for a bit.

Too much time dedicated to Jewish Studies?  Nope – a high-quality Jewish Studies program enhances secular academics.  Too much time dedicated to Skyping or blogging?  Nope – an innovative learning paradigm not only positively impacts student motivation, but leads to higher student achievement.

I can sense the tone of triumphalism in my writing and, although I am extremely proud of our students and teachers for their achievements, I do not wish to sound boastful.  But with the state of Jewish day school education being what it is, when there is good news to share…share it one must!  I firmly believe that Jewish day schools with dual-curricula (and in our case tri-curricula!) and innovative pedagogy and philosophy produce unmatched excellence in secular academics.  Here in our school, we will have to prove it year after year, subject after subject, and student after student in order to live up to our mutually high expectations, but what an exciting challenge it shall be coming to school each day to tackle!

This Is (Not) A Test: OJCS (Doesn’t) Prep For CAT-4

From October 29th-31st, students at the Ottawa Jewish Community School in Grades 3,  6 and 8 will be writing the Fourth Edition of the Canadian Achievement Tests (CAT- 4).  The purpose of this test is to inform instruction and programming for the 2018-2019 school year, and to measure our students’ achievement growth over time.

Seems pretty non-controversial, eh?

These days, however, the topic of “standardized testing” has become a hot topic.  So with our testing window ready to open next week, this feels like a good time to step back and clarify why we take this test and how we intend to use and share the results.  But first, two things that are new this year:

  • We moved our test window from the spring to the fall to align ourselves with other private schools in our community.  This will be helpful for comparison data.  (This is also why we didn’t take them last year.)
  • We have expanded the number of grades taking the test.  We have not yet decided whether that number will expand again in future years.

What exactly is the value of standardized testing and how do we use the information it yields?

It sounds like such a simple question…

My starting point on this issue, like many others, is that all data is good data.  There cannot possibly be any harm in knowing all that there is to know.  It is merely a question of how to best use that data to achieve the fundamental task at hand – to lovingly move a child to reach his or her maximum potential.  [North Star Alert!  “We have a floor, but not a ceiling.”]  To the degree that the data is useful for accomplishing this goal is the degree to which the data is useful at all.

Standardized tests in schools that do not explicitly teach to the test nor use curriculum specifically created to succeed on the tests – like ours – are very valuable snapshots.  Allow me to be overly didactic and emphasize each word: They are valuable – they are; they really do mean something.  And they are snapshots – they are not the entire picture, not by a long shot, of either the child or the school.  Only when contextualized in this way can we avoid the unnecessary anxiety that often bubbles up when results roll in.

Like any snapshot, the standardized test ought to resemble its object. The teacher and the parent should see the results and say to themselves, “Yup, that’s him.”  It is my experience that this is the case more often than not.  Occasionally, however, the snapshot is less clear.  Every now and again, the teacher and/or the parent – who have been in healthy and frequent communication all the year long – both look at the snapshot and say to themselves, “Who is this kid?”

When that happens and when there is plenty of other rich data – report cards, prior years’ tests, portfolios, assessments, etc. and/or teacher’s notes from the testing which reveal anxiety, sleepiness, etc. – it is okay to decide that someone put their thumb on the camera that day (or that part of the test) and discard the snapshot altogether.

Okay, you might say, but besides either telling us what we already know or deciding that it isn’t telling us anything meaningful, what can we learn?

Good question!

Here is what I expect to learn from standardized testing in our school over time if our benchmarks and standards are in alignment with the test we have chosen to take:

Individual Students:

Do we see any trends worth noting?  If the overall scores go statistically significantly down in each area test after test that would definitely be an indication that something is amiss (especially if it correlates to grades).  If a specific section goes statistically significantly down test after test, that would be an important sign to pay attention to as well.  Is there a dramatic and unexpected change in any section or overall in this year’s test?

The answers to all of the above would require conversation with teachers, references to prior tests and a thorough investigation of the rest of the data to determine if we have, indeed, discovered something worth knowing and acting upon.

This is why we will be scheduling individual meetings with parents in our school to personally discuss and unpack any test result that comes back with statistically significant changes (either positive or negative) from prior years’ testing or from current assessments.

Additionally, the results themselves are not exactly customer friendly.  There are a lot of numbers and statistics to digest, “stanines” and “percentiles” and whatnot.  It is not easy to read and interpret the results without someone who understands them guiding you.  As the educators, we feel it is our responsibility to be those guides.

Individual Classes:

Needless to say, if an entire class’ scores took a dramatic turn from one test to the next it would be worth paying attention to – especially if history keeps repeating.  To be clear, I do not mean the CLASS AVERAGE.  I do not particularly care how the “class” performs on a standardized test qua “class”.  [Yes, I said “qua” – sometimes I cannot help myself.]  What I mean is, should it be the case that each year in a particular class each student‘s scores go up or down in a statistically significant way – that would be meaningful to know. Because the only metric we concern ourselves with is an individual student’s growth over time – not how s/he compares with the “class”.

That’s what it means to cast a wide net (admissions) while having floors, but no ceilings (education).

School:

If we were to discover that as a school we consistently perform excellently or poorly in any number of subjects, it would present an opportunity to examine our benchmarks, our pedagogy, and our choice in curriculum.  If, for example, as a Lower School we do not score well in Spelling historically, it would force us to consider whether or not we have established the right benchmarks for Spelling, whether or not we teach Spelling appropriately, and/or whether or not we are using the right Spelling curriculum.

Or…if we think that utilizing an innovative learning paradigm is best for teaching and learning then we should, in time, be able to provide evidence from testing that in fact it is.  (It is!)

We eagerly anticipate the results to come and to making full use of them to help each student and teacher continue to grow and improve. We look forward to fruitful conversations.

That’s what it means to be a learning organization.