This is probably a couple of weeks later than I had hoped, but I am pleased to share with you the results of this year’s Annual Parent Survey! If you want a full comparison with last year, you can reread those results or toggle back and forth. What I will try to do here, is to capture the highlights now that we have a baseline for comparison.
The first thing to name is that the percentage of students represented in this year’s survey is lower than last year, even if it captures slightly more students. Last year’s survey covered 81 students and this year’s covers 84. Also, the survey is per student, not per family, which means that it is even less representative than that. In the service of anonymity, we have no way to know how many families the survey actually represents. Finally, for most of the sections below, only 70 students – or roughly 40% of the school – is represented in the results. (Surveys of 14 students did not include data outside the opening and closing questions.) We would love to see that number at 70% or higher in the future to be more sure that the results are valid, but as always, we believe that all data is valuable data.
Whereas it is common wisdom that folks with concerns are usually more likely to fill out these surveys, the truth is that it would only strengthen these numbers, because by and by they are pretty good! More than being worried about the motivations for why families do or don’t fill out surveys, we are most concerned that our families feel that they have an opportunity to provide us with feedback and, even more important than that, that the school factors in parent voice as it makes decisions. We can only hope that we prove to families each year that we do take voice seriously, we do lean into healthy critique, and we do want to hear from them. We will revisit when we give the survey, how long we keep the survey window open and how we could incentivize folks to fill them out. We will aim for over 50% next year and 70% in the years to come. In the meanwhile, let’s celebrate the parents who did participate and try to make meaning of what they are telling us.
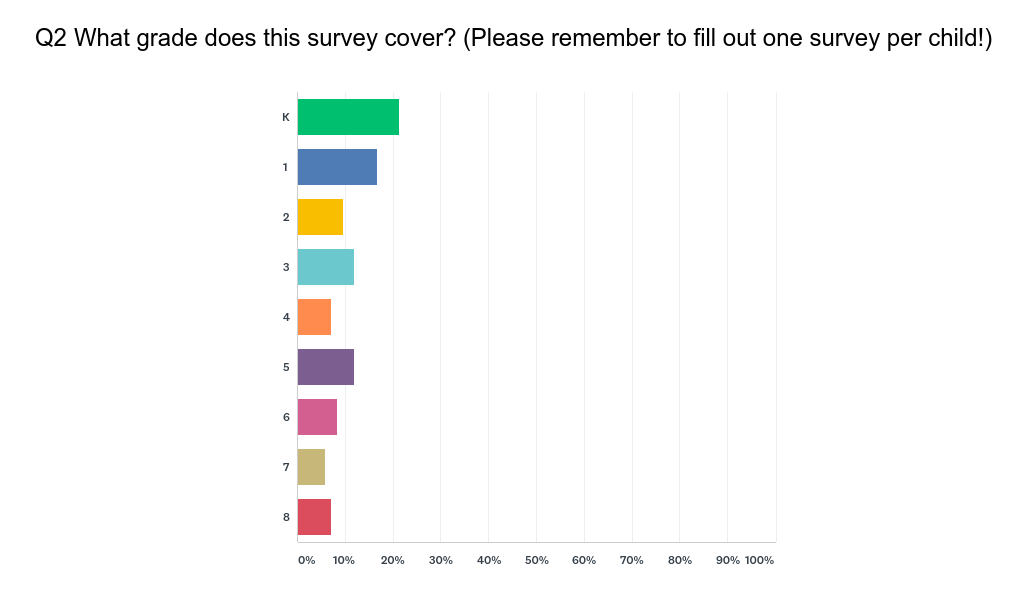
As was the case last year – and is usually the case everywhere – it is the parents of our youngest students who are the most invested with decreasing participation as the years go on. It is, however, a bit more representative than last year’s group.
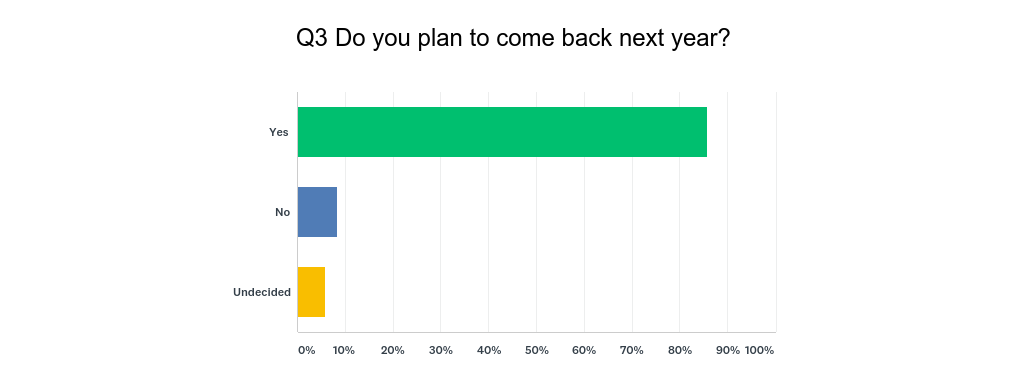
This percentage is higher than last year and is confounded a bit by the fact that families who are moving out of Canada for example, or who are graduating would sit in the same “No” with families who attritting before Grade 8. That the percentage is higher has some logic because our attrition rates are down again heading into next year, but I cannot unpack the “No” box while maintaining anonymity. All of this to say is, if it is true that our most critical parents are filling out this survey, the overwhelming majority intend to continue at OJCS. That says a lot about them and about us.
Let’s look at the BIG PICTURE:
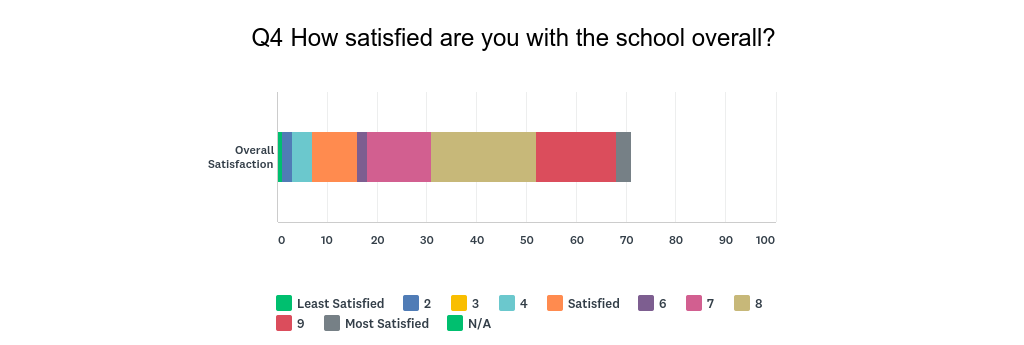
So I will remind/tell you that for this and all categories, we look at the range between 7-9 as the healthy band, obviously wanting scores to be closer to 9 than 7, and looking for numbers to go up each year. Last year, our score was 7.13 and this year it is 7.20. Is it healthy? Absolutely, although still closer to the low end of the band than we would prefer. Did it go up? Yes, although not as much we would like considering how much better a school we have become by a variety of other measures. Is there a disconnect between what the school believes is true and what parents see and believe? Is this a failure of communication? These will be important questions for us to chew on. Let’s dig deeper…
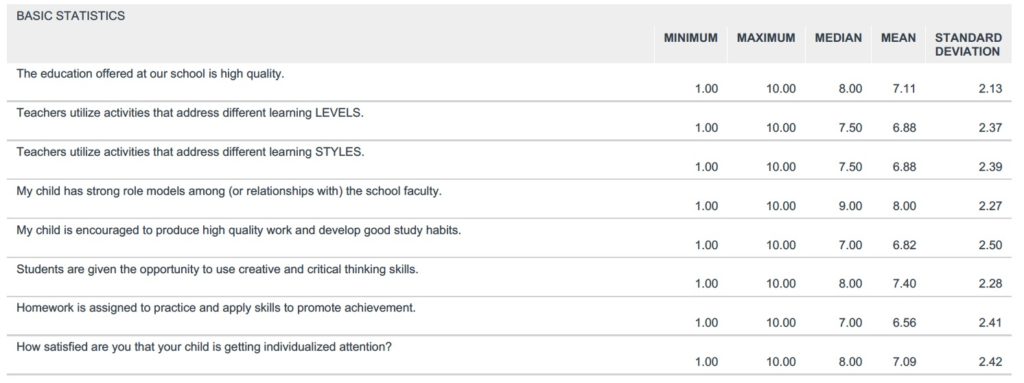
A few things jump out…
- The topline number is essentially unchanged (7.17 to 7.11), while remaining lower in the healthy band than we would like to see.
- Unlike last year, the score for “learning LEVELS” and “learning STYLES” is exactly the same, which leads me to wonder if people understand what we’re actually asking about (are these actually good or clear questions).
- Even the ones that are below the healthy range (in the 6s) are actually all up from last year, which hopefully means they will enter that range soon.
- I am pleased to see parents have pushed the question about individualized attention into the healthy range (7.09) as it is a core value of the school.
- Our lowest score (6.56) is connected to homework, which we had already identified as a critical concern. We hope that the new Homework Philosophy we shared out just a few weeks ago will help see that score rise when it is implemented next year.

- So here is where having comparison data is actually helpful. Each score in this section is lower than we want it to be and each score in this section is higher than it was last year. (Remember that we think 7-9 is the healthy range; a “5” still means “satisfied” on the scale).
- The topline number is still below a 7 and that still remains unacceptable. It may round up, but next year it has to get there on its own.
- The biggest improvements in this section are connected to our ability to meet the needs of students with IEPs and we know it is connected to our having hired a Director of Special Education this year. We also know that it is not yet where we want it to be, but this is a clear example of where parent voice, aligned with teacher and student voice, leads to meaningful action. (Fill out those surveys y’all! We really do pay attention.)
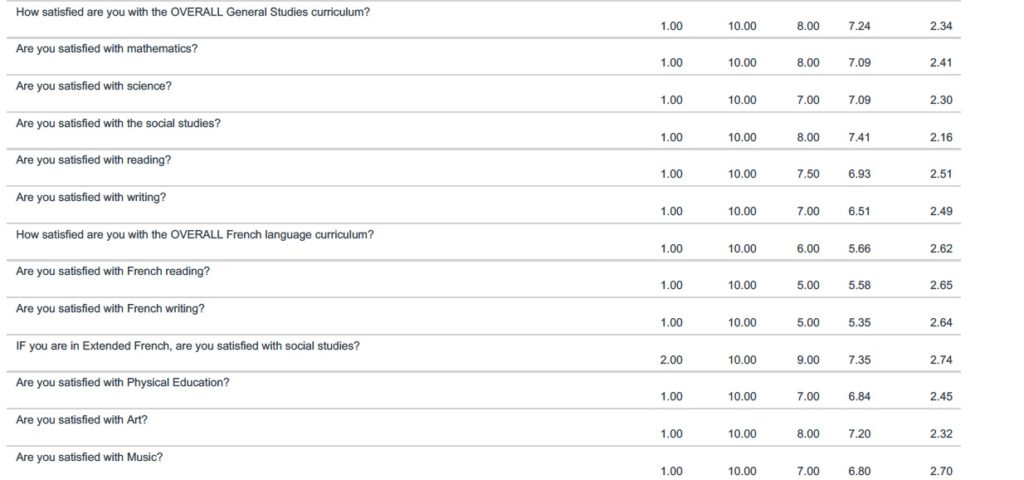
As was the case last year, there are no huge bombshells, but there are some things worth pointing out…
- The topline number is essentially the same (7.27 to 7.24).
- Our lowest scores (and we added two new sub-questions in this category) deal with French and we are excited to see those numbers begin to approach healthy levels as we move forward next year with the intense professional development for our French Faculty that we announced earlier this week. We are a bit disappointed that the added contact time and rigor have not yet registered, but we know they were steps in the right direction. Our newest families have the same high expectations of us that we have for ourselves, and now it is time for the school to deliver on its promises. This is another clear example of where parent voice, aligned with teacher and student voice, leads to meaningful action. (Fill out those surveys y’all! We really do pay attention. We even wrote it twice to be sure you noticed!)
- From the comments in the experimental section on French outcomes, it is very clear that we do, in fact, have three populations at OJCS. We have families who are satisfied with what we presently offer with a “Core” and “Extended” program. We have many families who want to see the quality of those programs increase, especially the ones who are counting on our ability to graduate students out of “extended” into Grade 9 immersion programs. We also, however, have families who would like to see us – at least as an option – provide an analogous immersion experience to the public board. This conversation, as we said, is just beginning.
- We noted last year that we were counting on Art, Music and PE to be improved by assigning them teachers who could focus more exclusively on these specialties and we are pleased that each score has gone up!

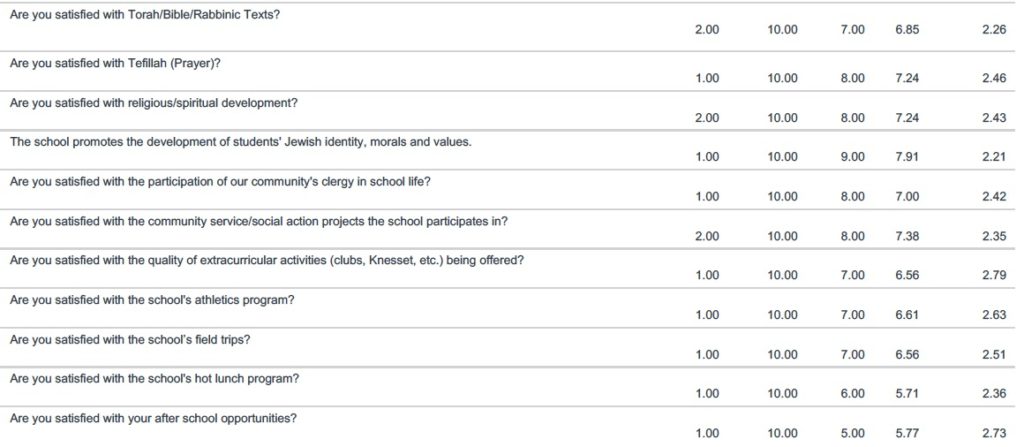
- With regard to Jewish Studies, we are very pleased that all our numbers are significantly up from last year and have entered the healthy range (one score needs a little rounding to get there, but still)! Reading last year’s results, I said that, “I fully expect that the changes we proposed for Jewish Studies – emphasis on Hebrew fluency, reinstitution of structured tefillah, etc. – will lead to higher scores in the year to come.” Well…we made those changes and it is wonderful to see that they landed with our families.
- We clearly have work remaining to bring our hot lunch program, our field trips (both quantity and quality), and helping our friends at the JCC with feedback about after-school programming to bring those scores into the healthy band…speaking of after-school programming…
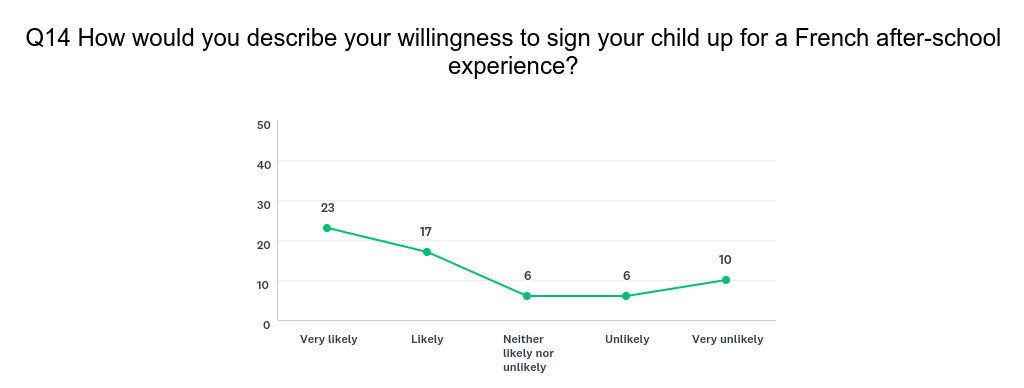
From our experimental section, we gain this data point. If we have at least 40 students, as is indicated, expressing interest in a French after-school experience, we have a responsibility to figure out the how and the what. Stay tuned.
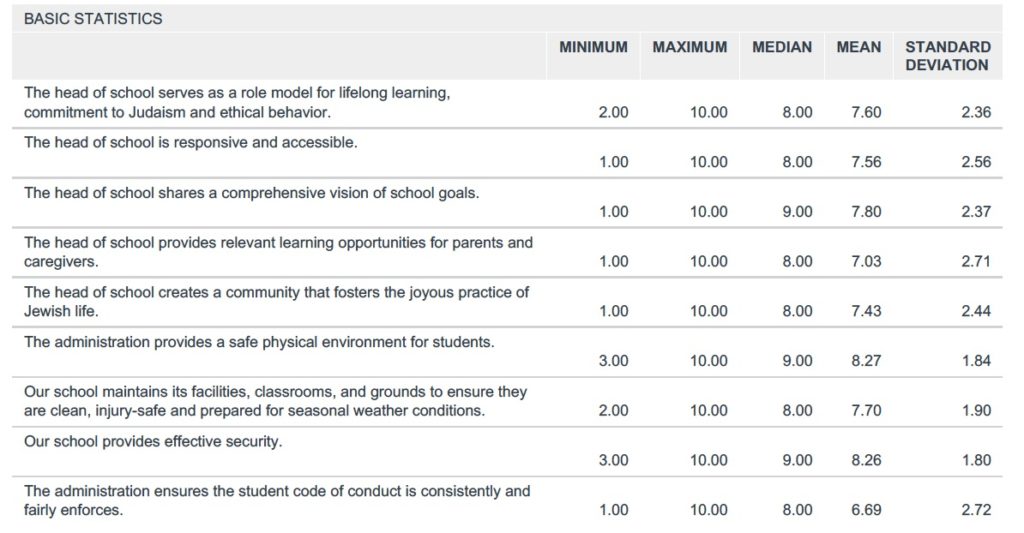
- I will hold most of my comments on my own scores for an upcoming “Transparency Files” with my full self-evaluation. Here, I will simply say that I am relatively pleased with stable scores in the healthy range.
- My lowest score is in providing learning for parents…and I agree! I am legitimately struggling to figure out how to do this better with the busy lives of our parents. Last year I tried to teach a weekly class, but we couldn’t carry a critical mass week-to-week to make it viable. I’m open to suggestion (like, please do) on how to do this better. Help me to help you to help me.
- Our lowest score in this area (ticked slightly down from last year’s 6.97) is about our “code of conduct” and we are pleased to share that we are working on launching a new, school-wide behavior management system next year based on the “7 Habits” and anchored in our “North Stars”. I will be surprised if this score doesn’t go up next year.
Last data point:
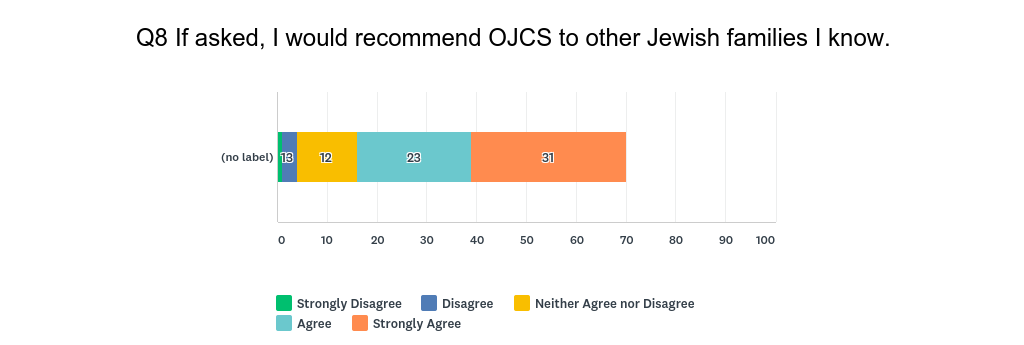
Remember this question was scaled 1-5. Our score is interestingly unchanged at 4.14. I’m not sure how much more room to go up there is, but it is a windmill we will gladly tilt at.
So there you have it for 2018-2019!
Thanks to all the parents who took the time and care to fill out surveys! In addition to the multiple choice questions, there were opportunities for open-ended responses and a couple of experimental sections. Your responses added an additional layer of depth; one which is difficult to summarize for a post like this. Please know that all comments will be shared with those they concern as you have seen that we really do use this data to make enhancements and improvements each year. By the by, we are pleased with how well satisfied our parents are with how the school is going…but be assured, just like with everything else, we expect to see growth and progress in a school where there is “a floor, but no ceiling”.
In the next few weeks, I will look forward to sharing my self-evaluation, an exciting enrollment update, and to introducing the 2019-2020 OJCS Faculty!


A very interesting read. A couple questions/thoughts….
1) With respect to parental education, I’m not clear on what the goal is or what type of education we should be thinking about. Parenting classes (discipline, etc.)? Lessons specifically geared toward teaching things about being a *Jewish* parent? Classes about child psychology? Or something entirely different? It might be easier for parents to express their wants/needs if we knew what types of things you had in mind when offering these classes.
2) One of the things not reflected in this study is the way parents feel about students’ interactions with the Hillel Lodge. Personally, it’s one of the wonderful things about the school. It’s a huge part of building community. It’s also so important that kids learn to engage with elderly members of the community (instead of being terrified of anyone over 75, as I was for most of my youth…). The opportunities for students to work on developing biographies for residents at the Lodge was an amazing initiative in Grade 4! I have no idea whether other parents care about the connection between the school and the Lodge, but it’s really something I value that I know wouldn’t exist in other schools.
3) The Hot Lunch program…Sigh. Where to begin? I know it’s a project of the PTA, therefore not managed by the administration. But it’s not surprising to see these results. I understand that last year students weren’t crazy about the food because it was “too healthy”, but that this year sales are way up because there are far more “junk food” (the words of a member of the PTA, not mine) offerings. Surely there’s a middle ground between black bean burgers (2018) and “latke and sufganyia” (2019). We’ve gone from vegan hippie food to a completely unbalanced, carb-laden junk fest! I also find that the lunches are unbalanced – I generally look for a protein, a starch, and some vegetables and/or fruit. Protein is seriously lacking in many of the lunches. I understand how hard it is to please everyone. And I know kids can be picky. I also know that fundraising is way up now that the offerings are less healthy, but it doesn’t seem right to raise money for the school by offering poutine or “latkes and donuts” to students as a lunch. Those aren’t lunches and don’t fuel the kids for learning throughout the afternoon. The price is also quite steep for some of what’s offered. $8 is fine for sushi, but too much for hot dogs (I know, I know it’s “the big money maker”), or soup.
Thanks!
Thanks for making a quality comment! I hope you will inspire more parents to do the same!
I am collecting comments that deal with hot lunch or the PTA in general for a pending conversation with PTA leadership…
You are so right about Hillel Lodge. I was blown away last year as a Grade 4 parent by that year’s project, but the overall engagement is such a value add to us and to them. We should talk about it more.
With regard to parent education…the answer is…yes, to all. I have taught and tried it from the parenting lens (let’s address meaningful issues of parenting), the Jewish education lens (how does the experience of having a child in a JDS impact parents and families), the education lens (how can we better understand what education should look like in 2019 and beyond), the Jewish lens (how can we partner with parents to support Jewish experiences in families), etc. We are down for whatever would be meaningful to our parents. Daytime workshop? Evening class? Virtual learning? One-time experience? Regular experiences? We could issue a survey it is easier, but we can build parent engagement experiences around anything parents will find…engaging. We just have to figure out what that is and how to schedule.
Thanks for your feedback and suggestions!