Just when you thought you were out…they pull you back in.
🙂
Yes, I know. I said last year that after years of diminishing returns, we would finally put to bed this version of the Annual Parent Survey and start transitioning to new feedback loops that would – hopefully – yield greater engagement and, thus, more actionable data. And that will be the path forward…next year, when the school will be under new leadership.
With our energies focused on the future and the hope that the pending change in leadership would inspire greater participation, we once again invited current OJCS Parents to share feedback. And, that hope did pay off with a meaningful uptick in participation. Last year, although 47 individual surveys were turned in, only 36 individual surveys provided data on the main sections. This year, 62 individual surveys were turned in, with only 48 who provided data on the main sections. It is a better result, but still, this means that this survey represents less than 25% of the students in our school. This is why the decision to pivot to a different methodology is warranted.
It simply defeats the purpose of gathering feedback in service of making decisions that impact students if only 1/4 of students are sharing that feedback. Whether we move to a third-party vendor, a new format for surveys, focus groups, or some combination therein, the school will cast a different and a wider net to ensure it truly captures the feedback it needs – and that your children deserve – to aim closer to the OJCS North Stars; to be the best version of OJCS.
But that’s the future…for now, one last time, let’s thank and lean into the parents who did participate and try to make meaning of what they are telling us. [If you would like to see a full comparison with last year, you can reread those results, or have them open so you can toggle back and forth. In this post, I will try to capture the highlights and identify what trends seem worth paying attention to.]
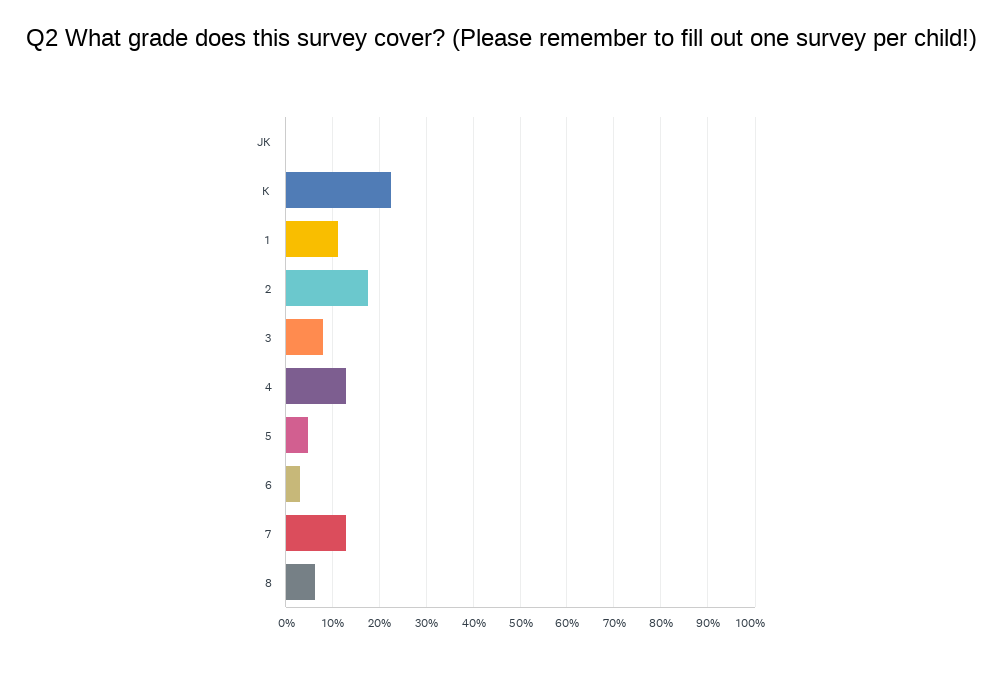
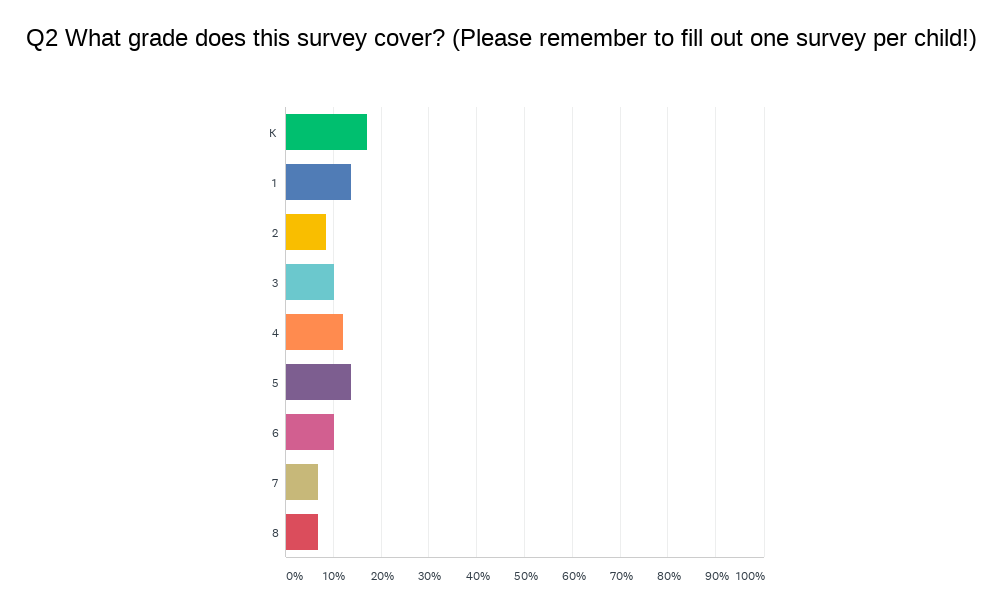
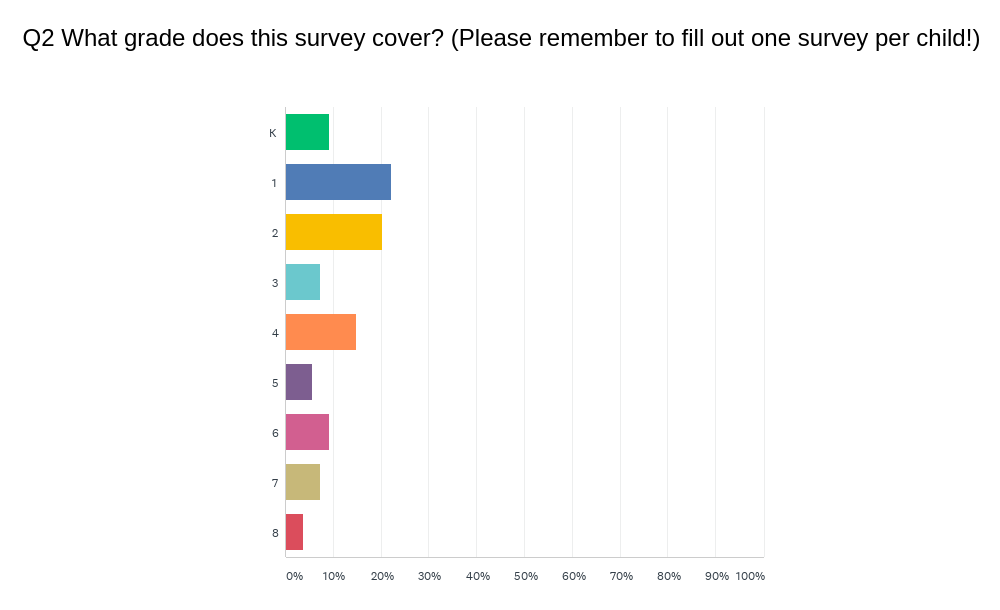
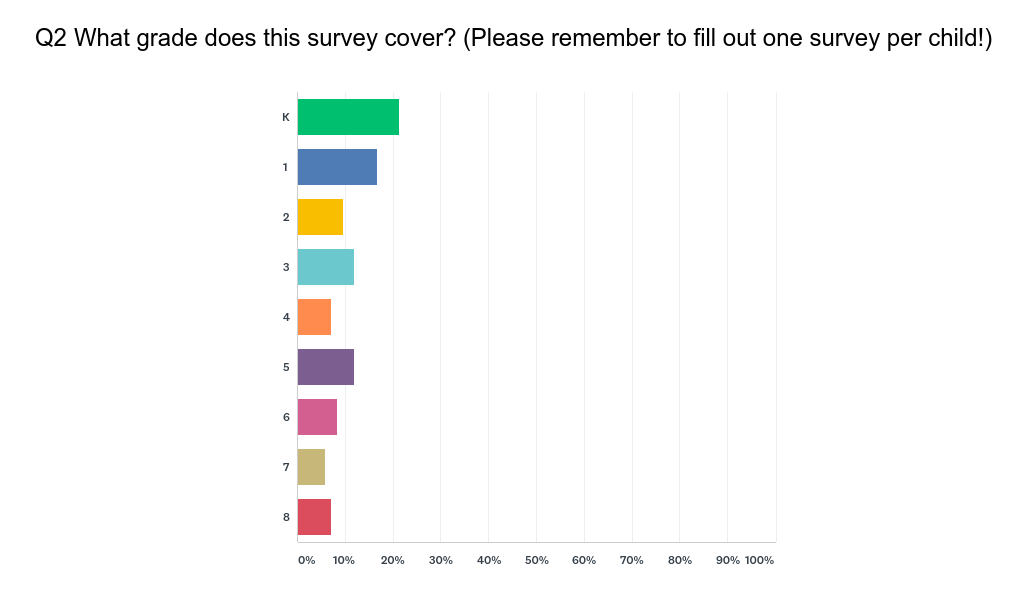
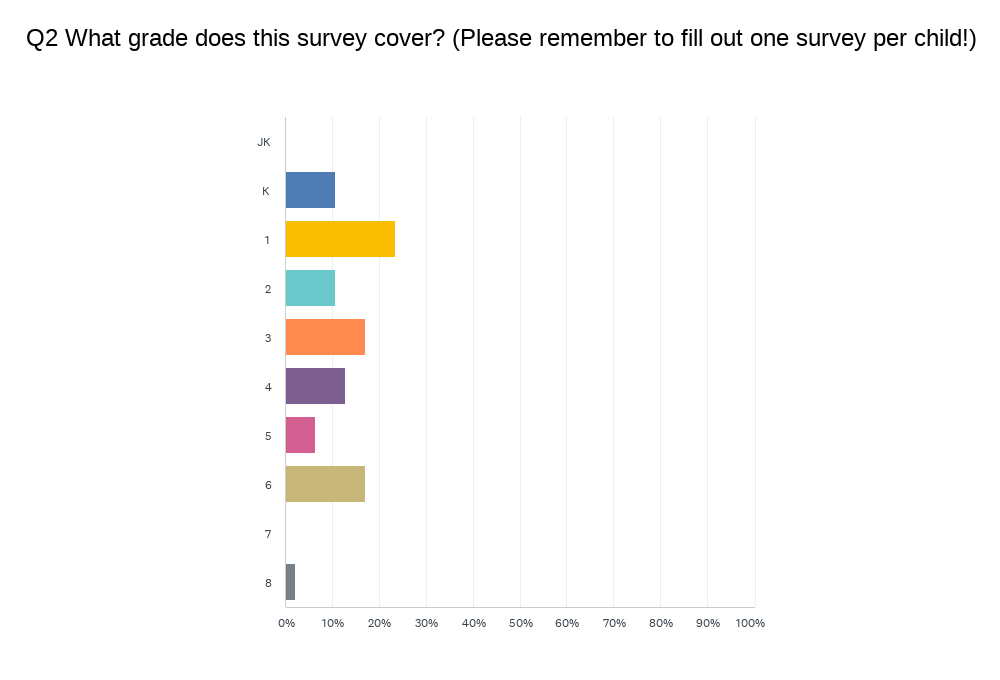
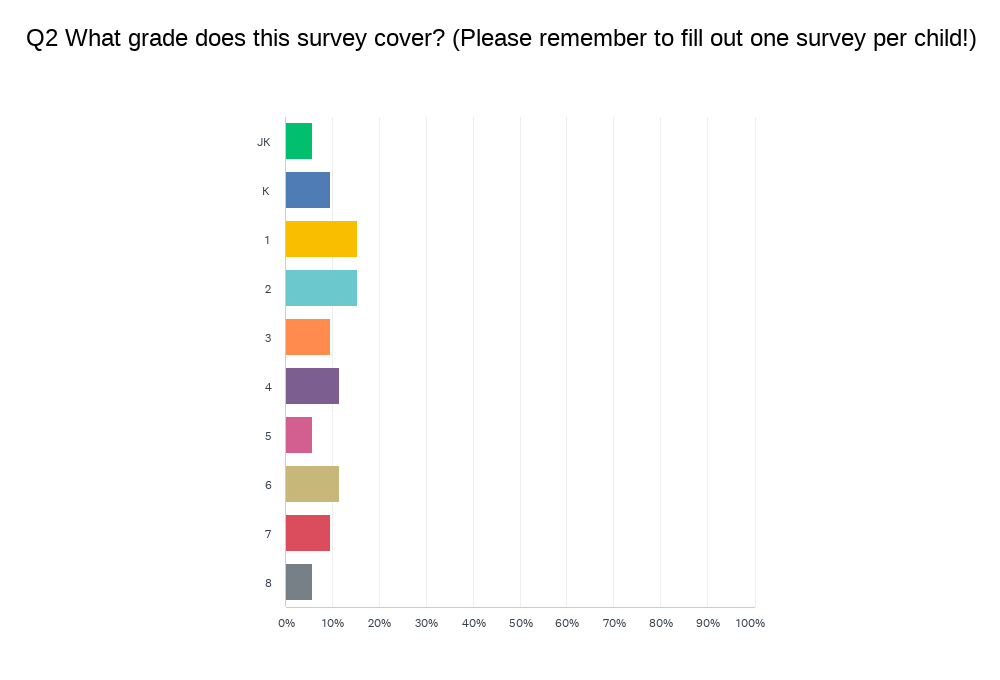
This represents a decent distribution…it does make questions about “high school readiness” less helpful with such little representation from Grade 8.
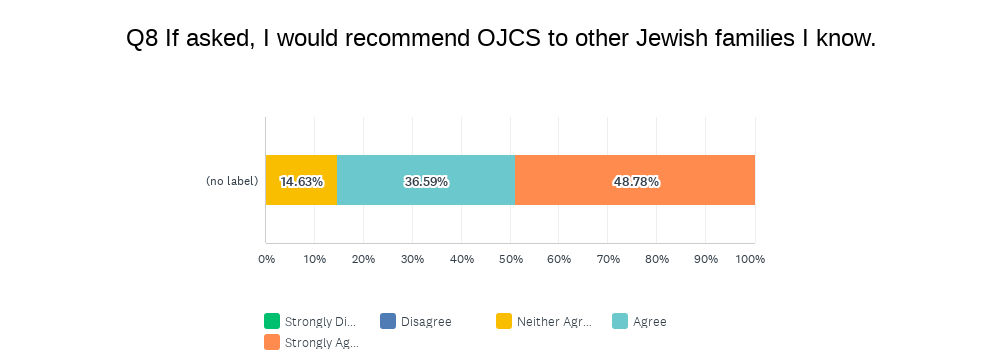
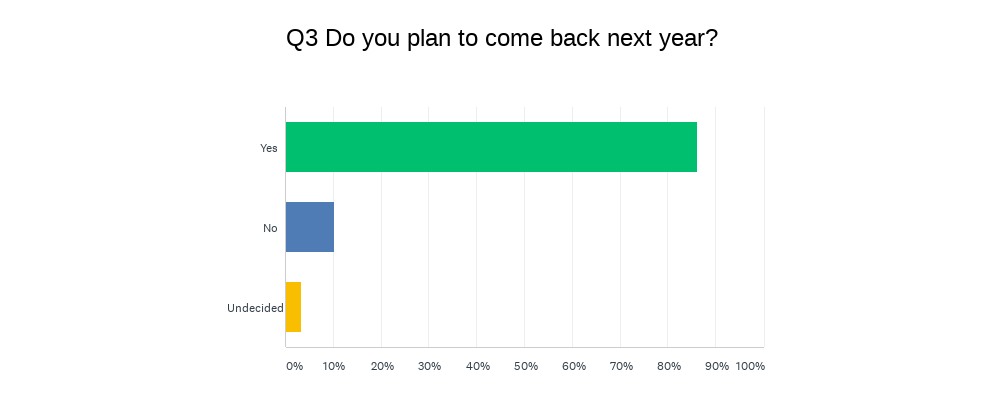
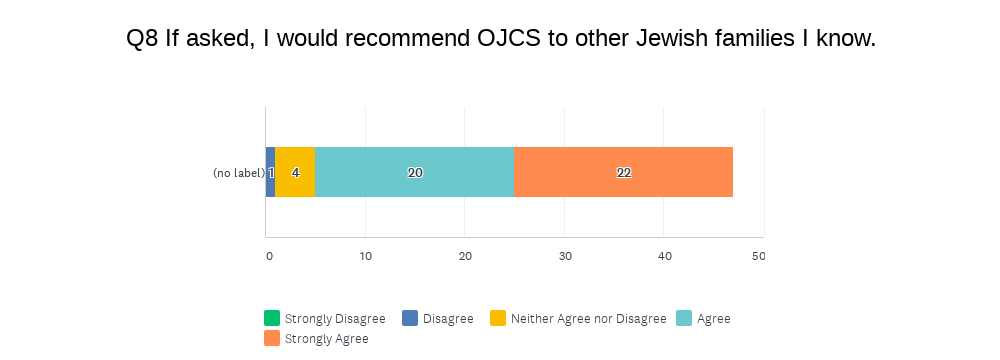
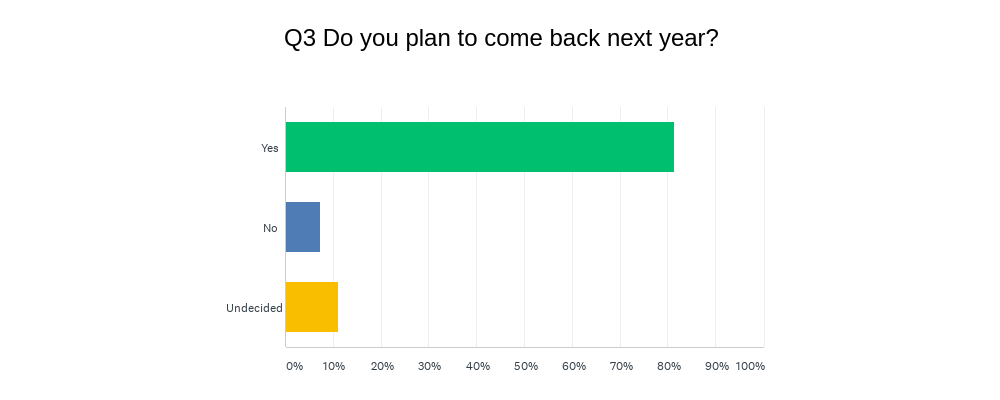
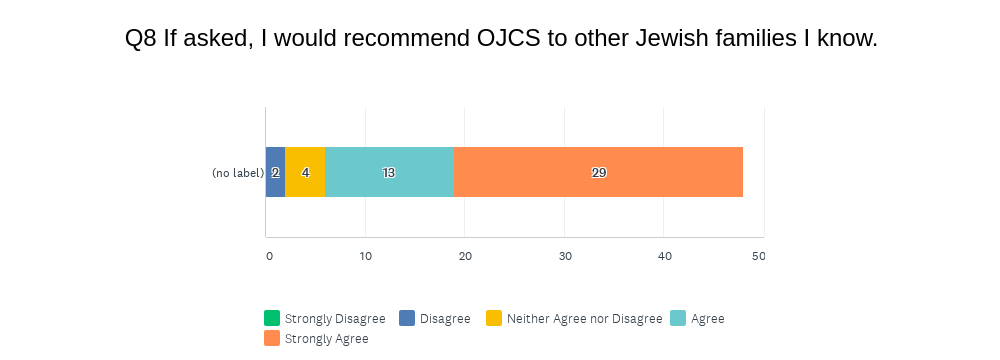
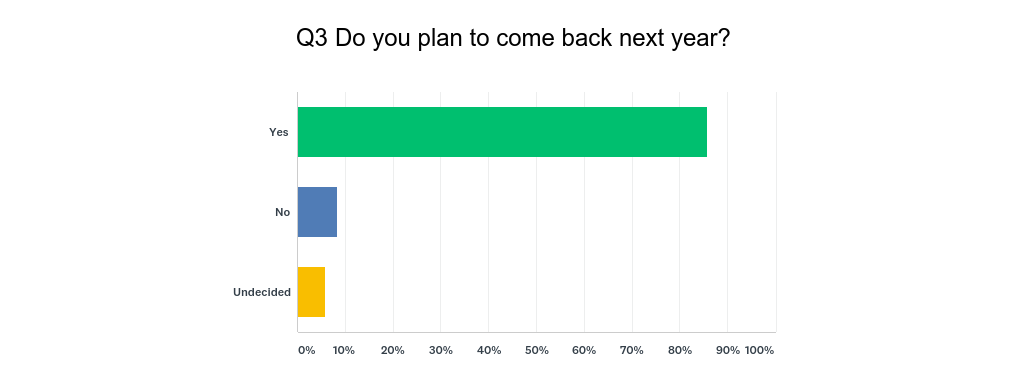
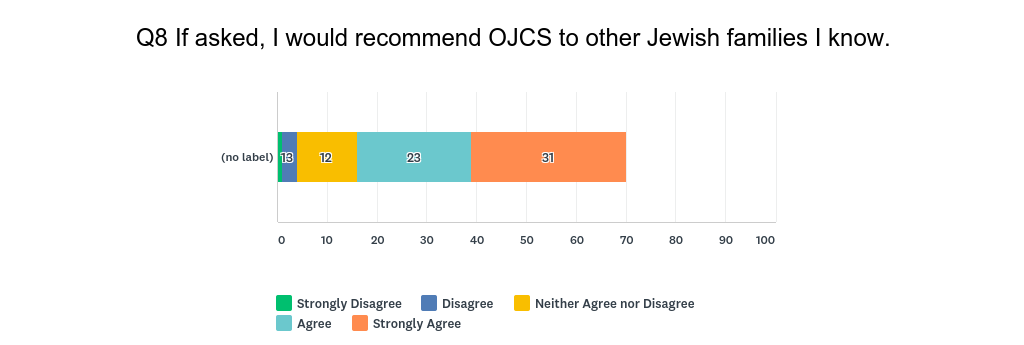
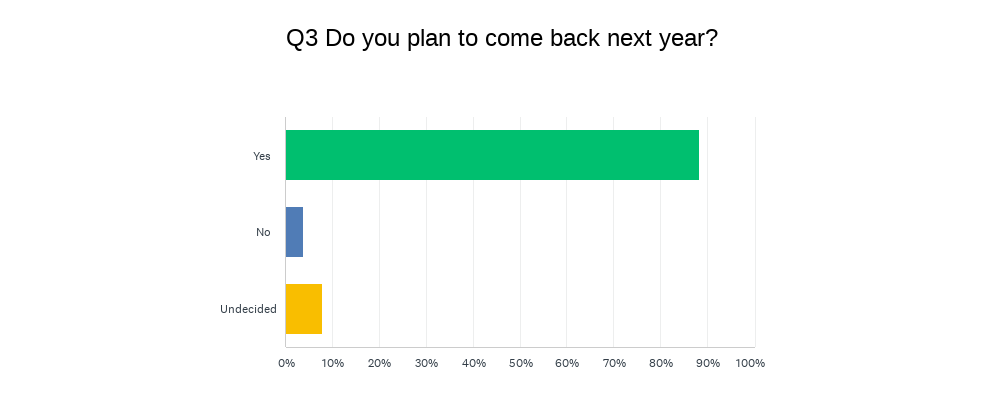
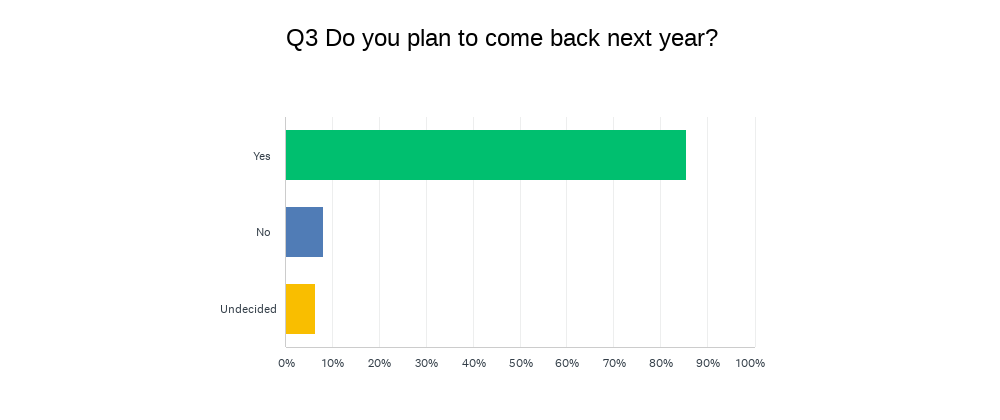 Without knowing how representative this quarter of students is, this year’s data set is lighter on the “NOs”. Of course the “NOs” are always complicated to unpack because we have no way of knowing who of the “NOs” represent graduation or relocations, as opposed to choosing to attrit prior to Grade 8. However, what continues to be true is that the overwhelming majority of families – regardless of their feedback – stay with us year-after-year.
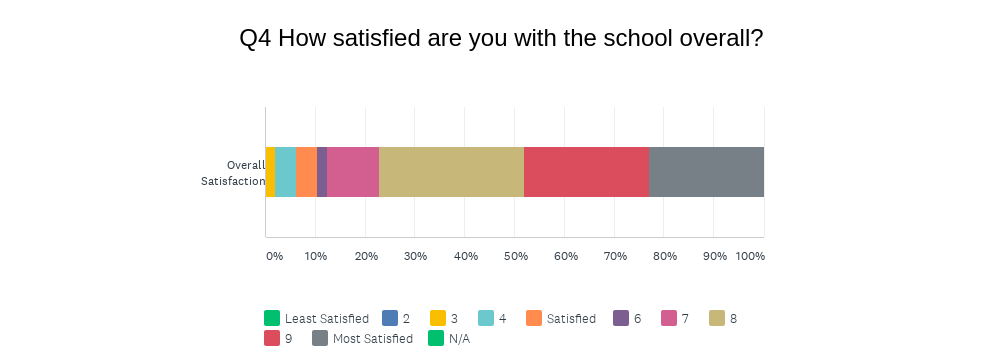
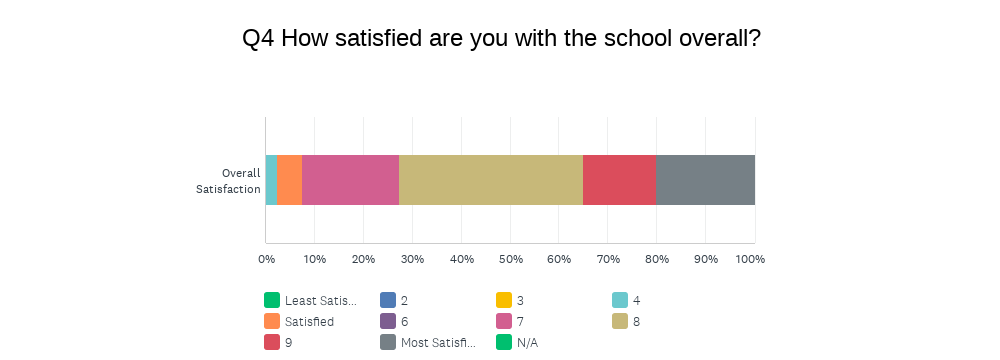
Let’s look at the BIG PICTURE:
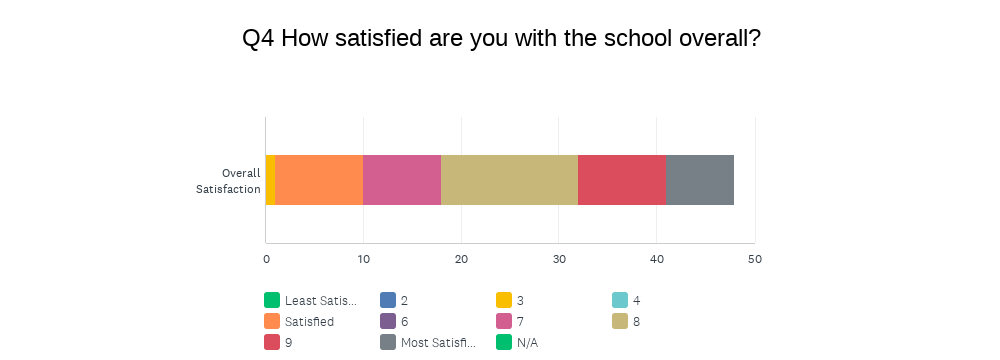
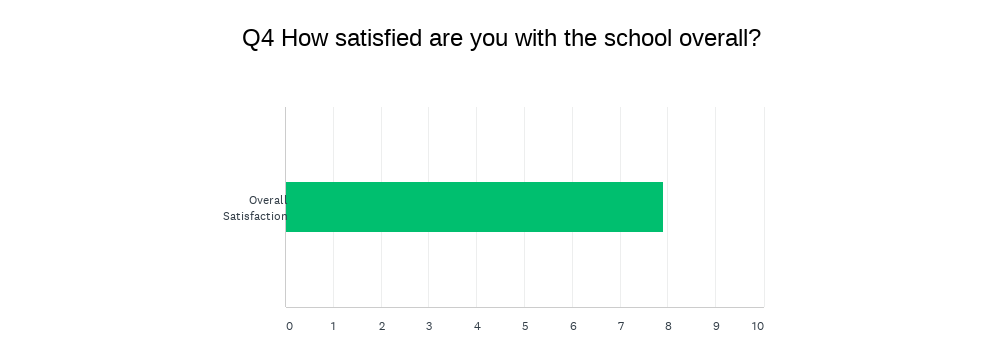
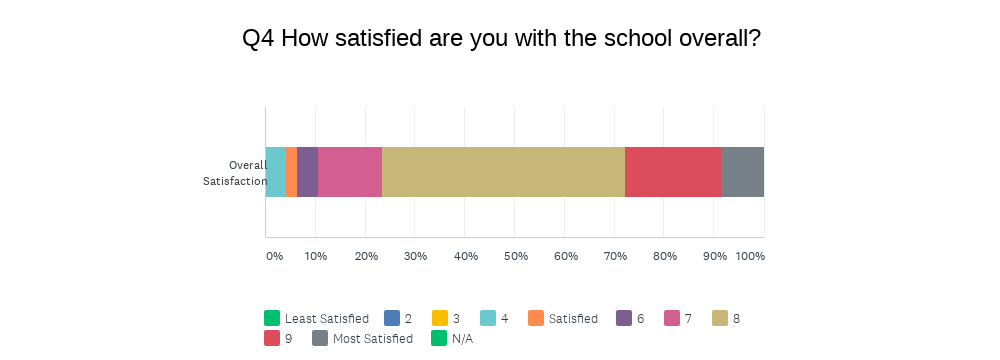
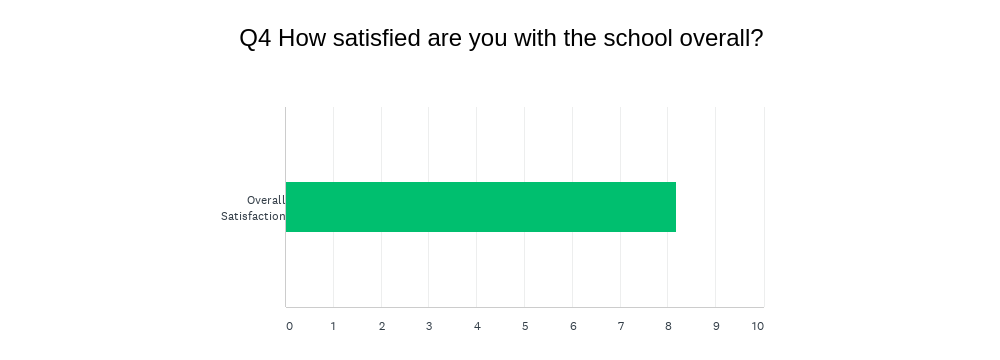
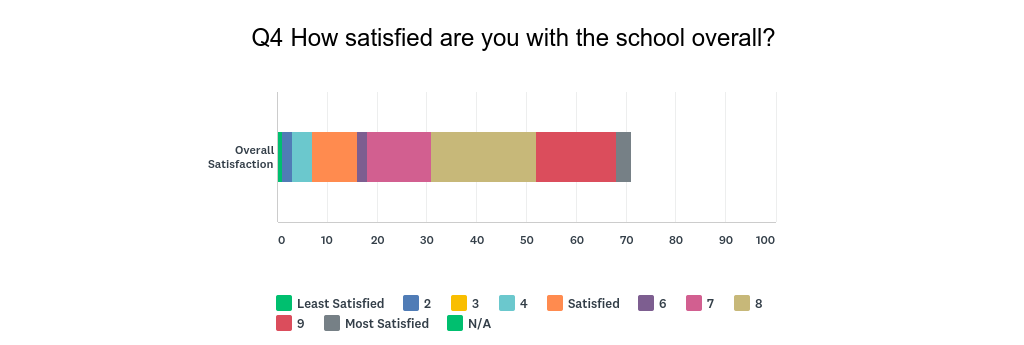
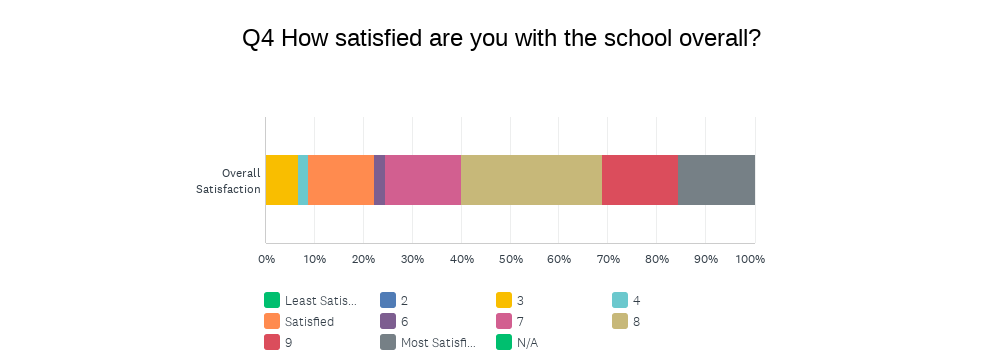
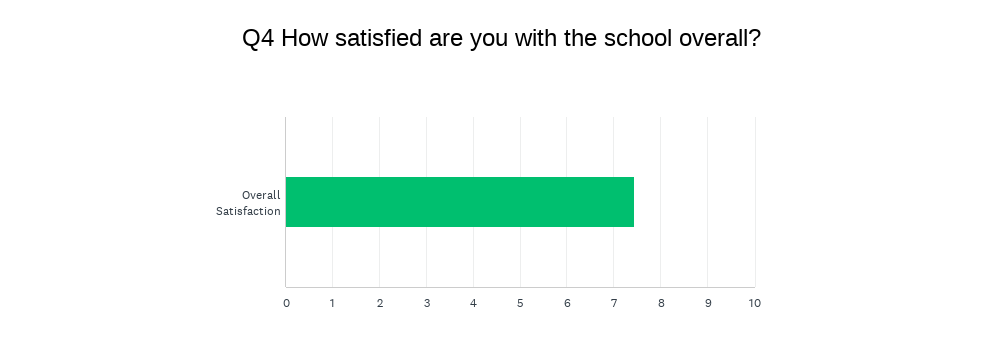
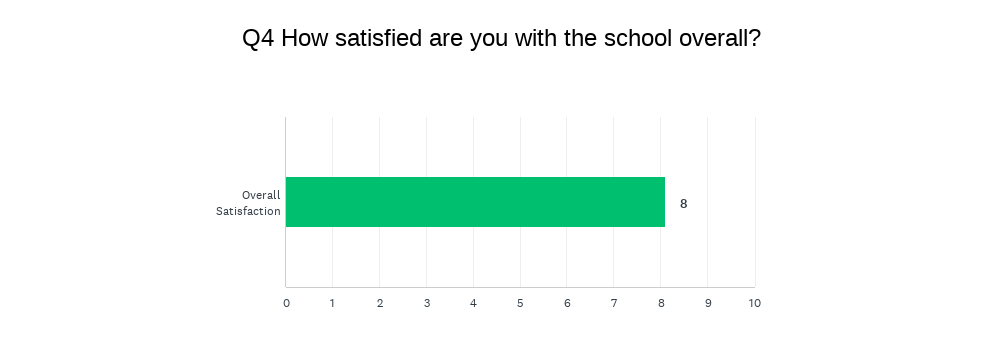
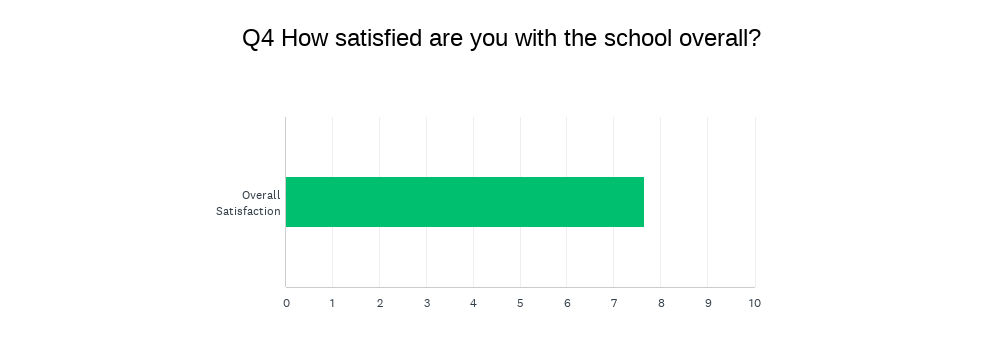 The first chart gives you the breakdown by category; the second chart gives you the weighted average satisfaction score (out of 10). I will remind you that for this and all categories, I look at the range between 7-9 as the healthy band, obviously wanting scores to be closer to 9 than to 7, and looking for scores to go up each year. In terms of “overall satisfaction”, we have now gone from 7.13 to 7.20 to 8.17 to 7.91 to 8.0 to 7.44 to 7.53 to 7.65 Although it continues to tick up over the last two years, the differences are statistically insignificant.
Overall, this seems to be a good news story, but let’s dig deeper…

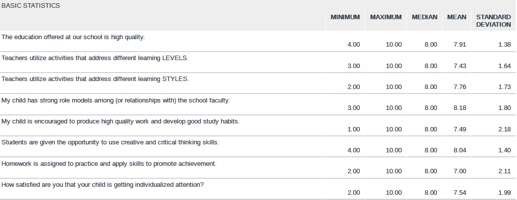
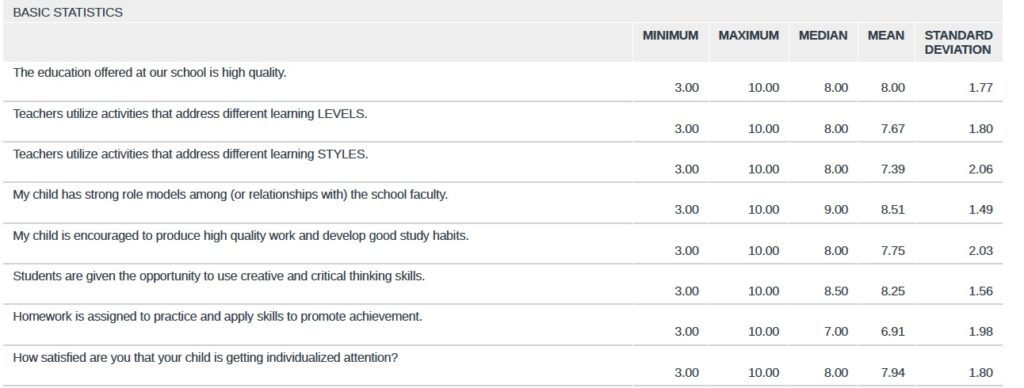
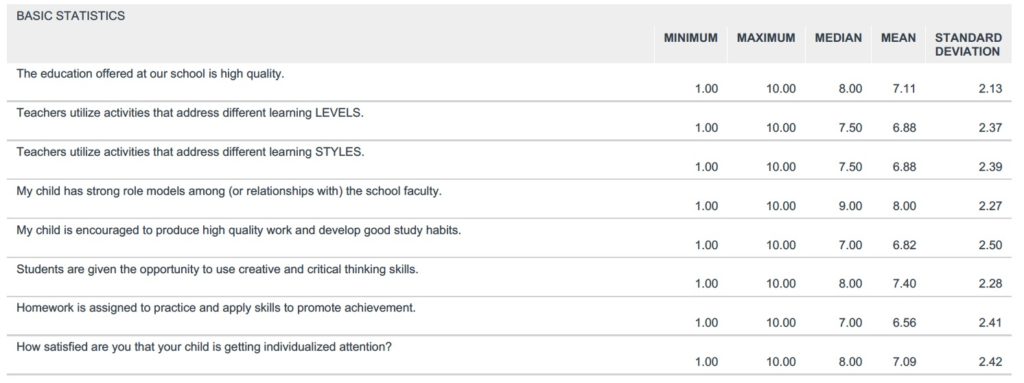
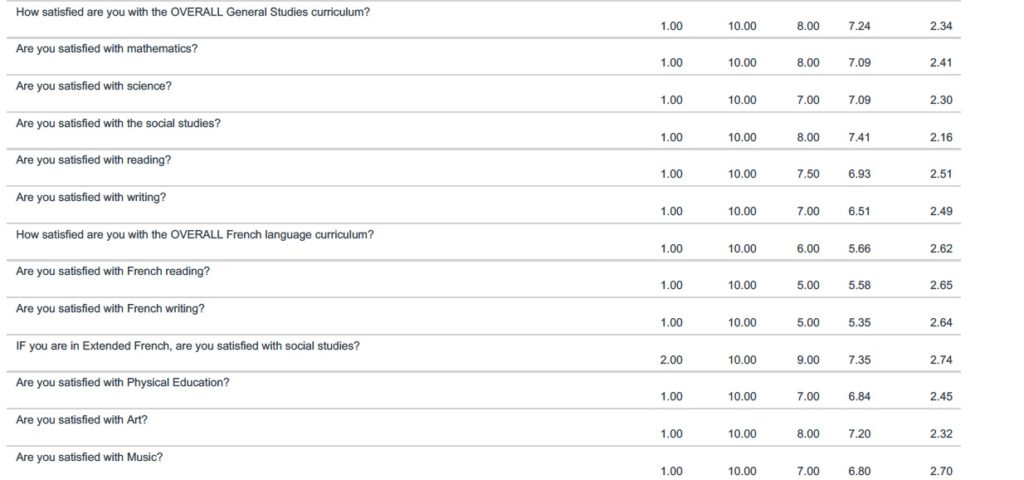
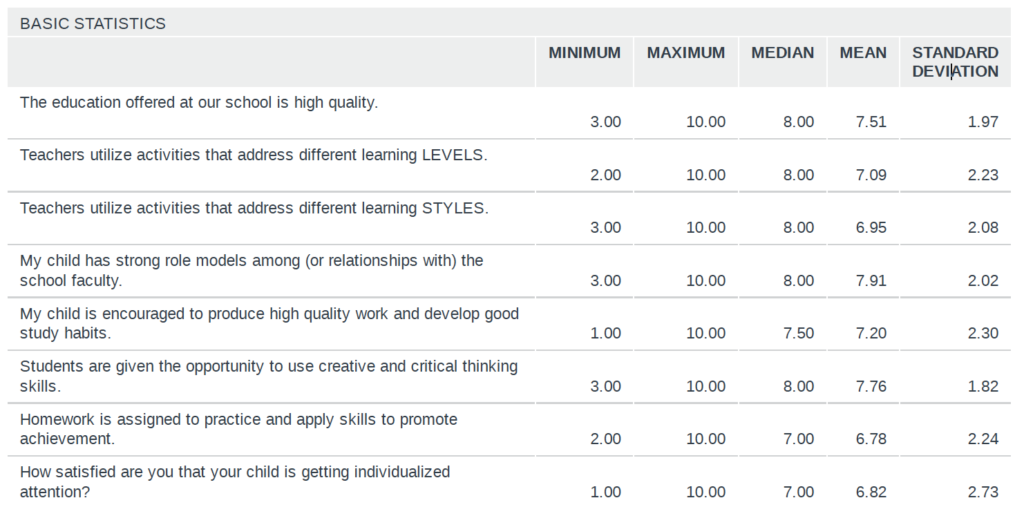
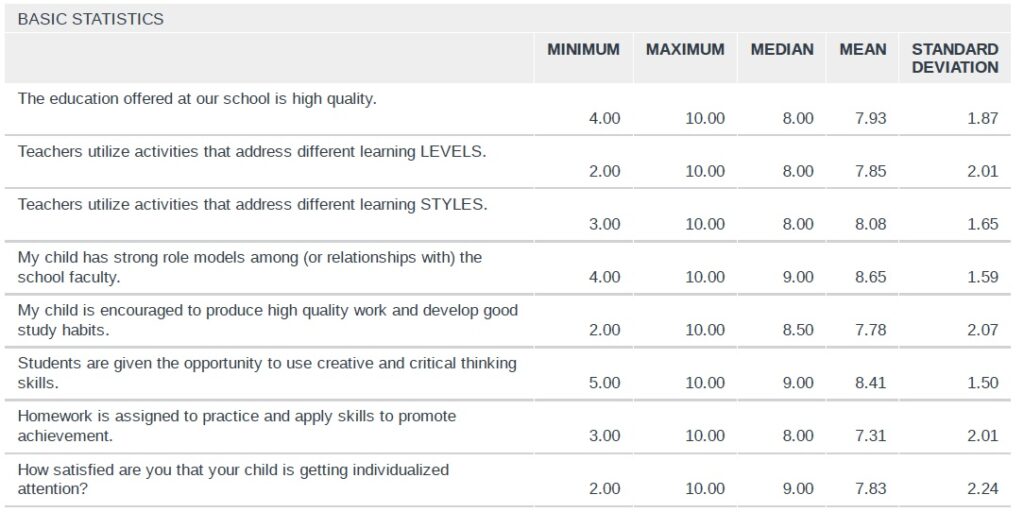
Each and every one of these numbers are not only up from last year, but may very well be the highest we have ever scored! Not one below the “acceptable range” and a lot are, or nearly are, at an “8”.
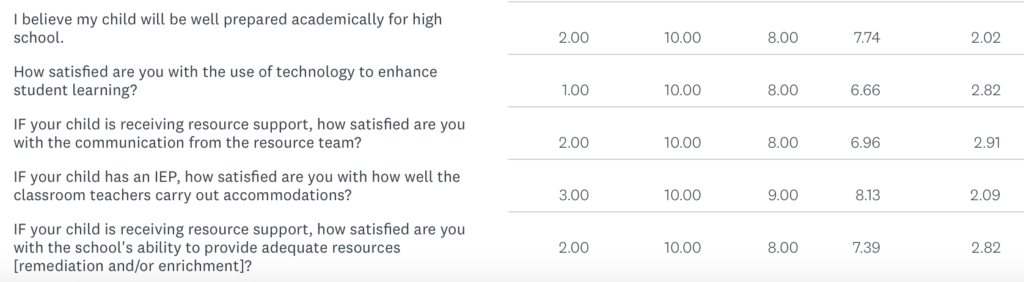
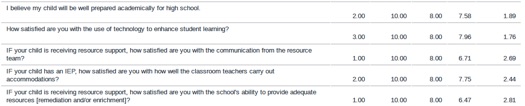
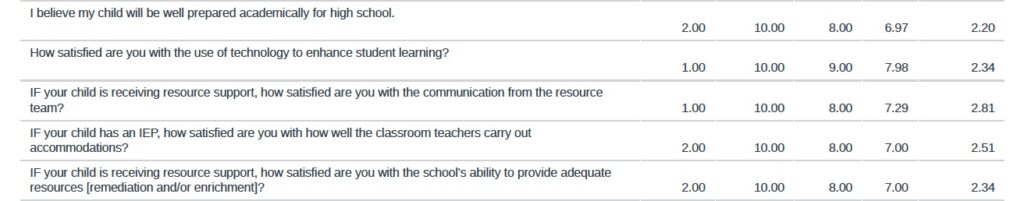
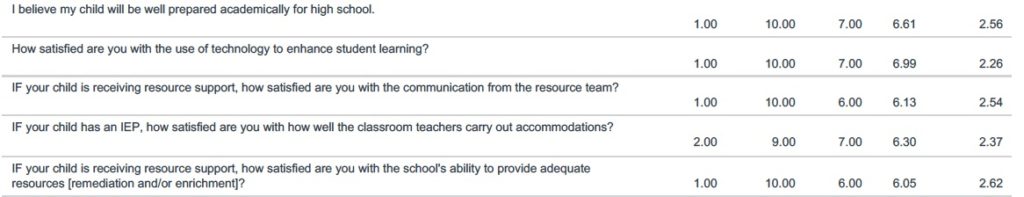
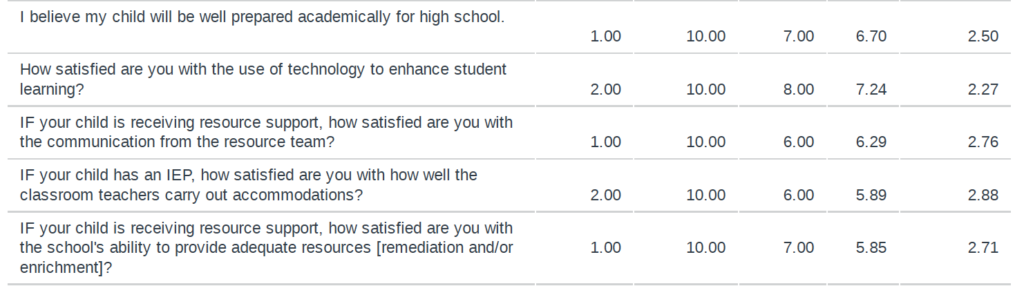
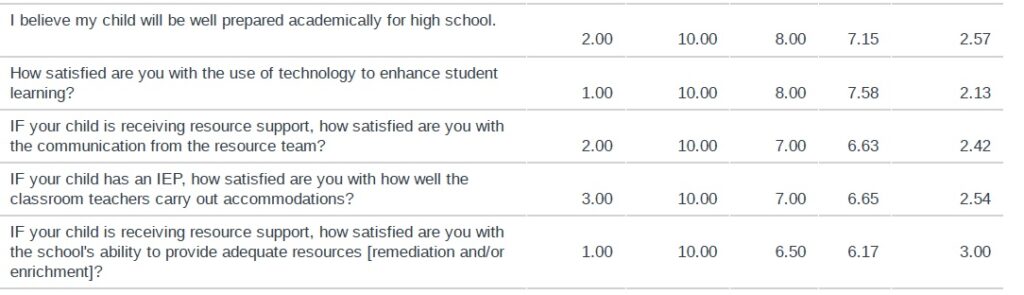
This is an interesting split. The topline number – being prepared for high school – is one of the highest scores we have received. The one number that took a dip is about “technology” and that is not a surprise considering the ambivalence many parents are sharing with us. The good news is that between our work with The Social Institute and The Anxious Generation – work that Mrs. Thompson is leading – OJCS is tackling this head-on and in partnership with our parents.
The numbers connected with IEPs and resource are as high as we have received, with the acknowledgement that the communication result (just barely below 7.0) has room to grow.
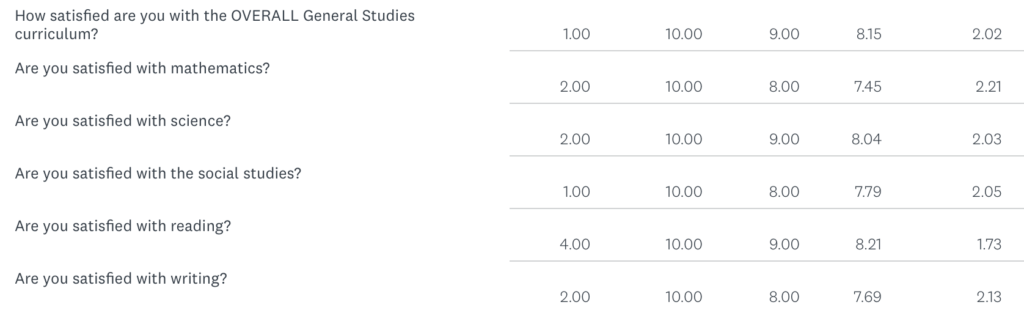
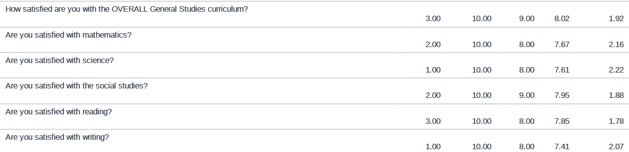
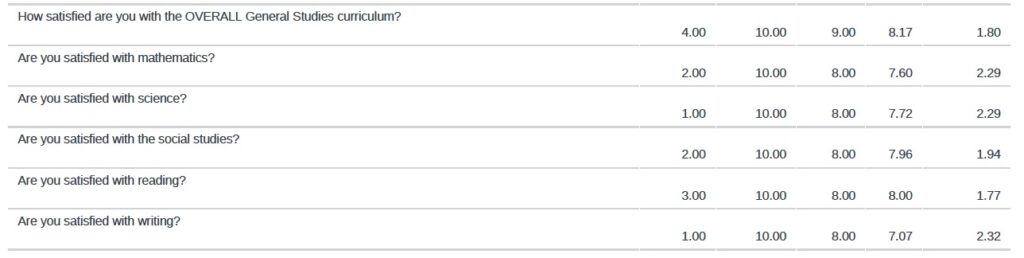
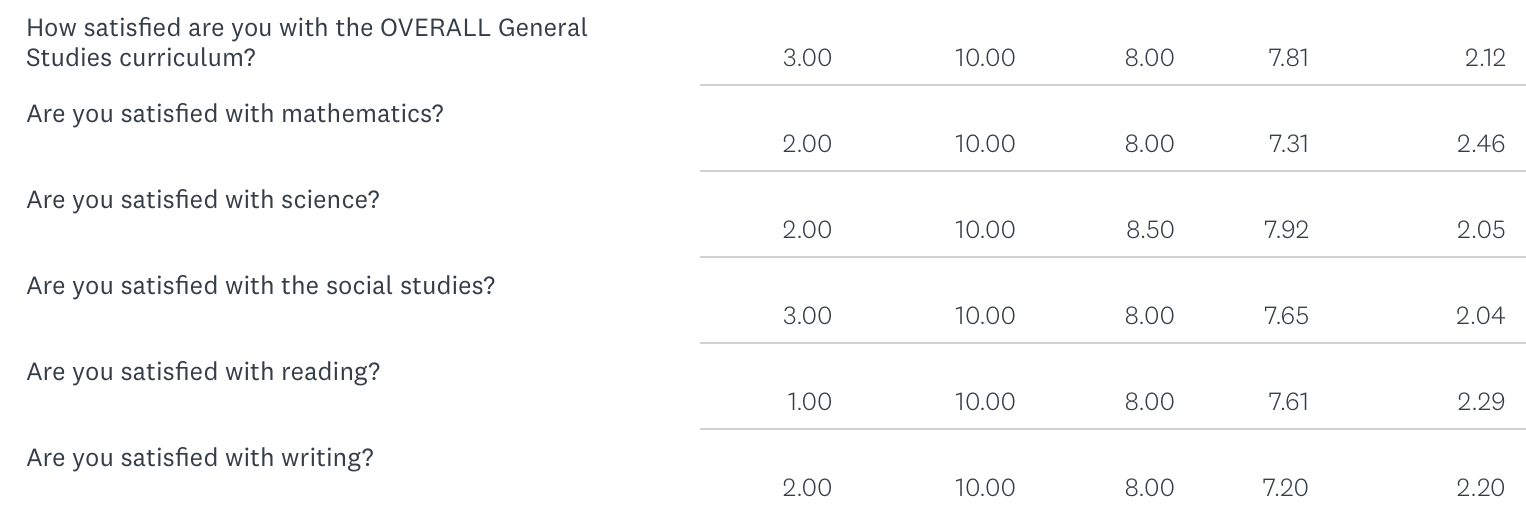
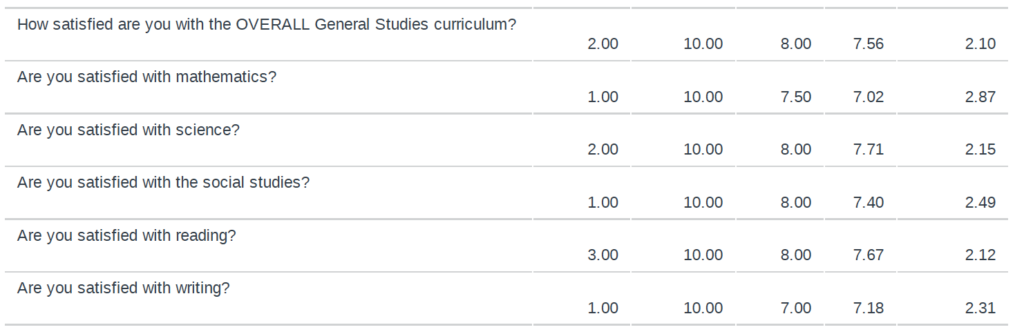
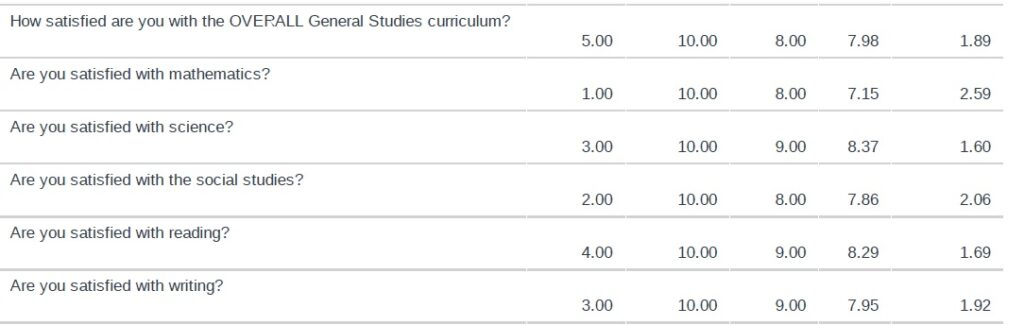
These are just about the highest numbers we have ever had! First time cracking 8.0 for the topline number and a few of the subcategories.
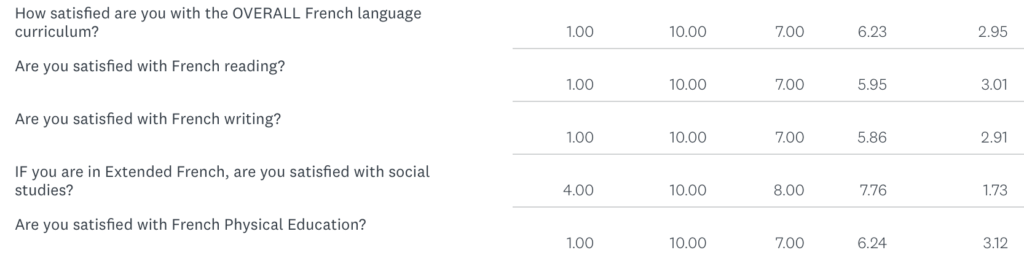
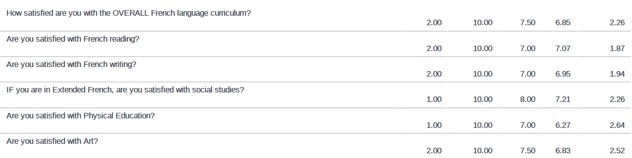
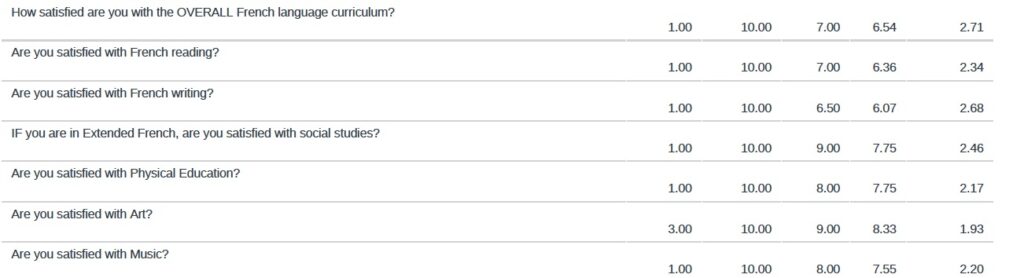
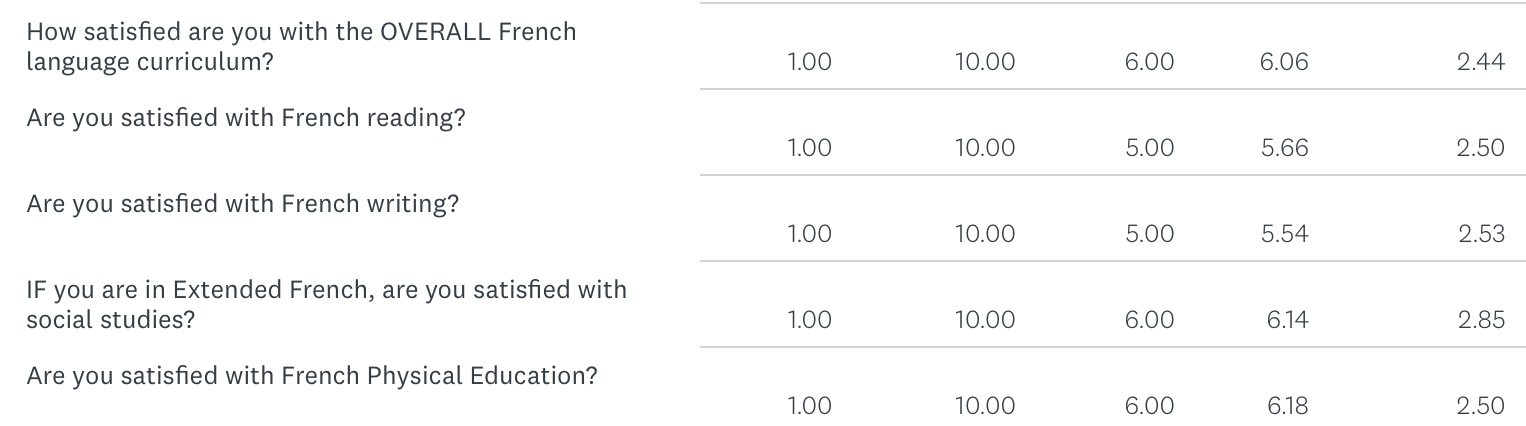
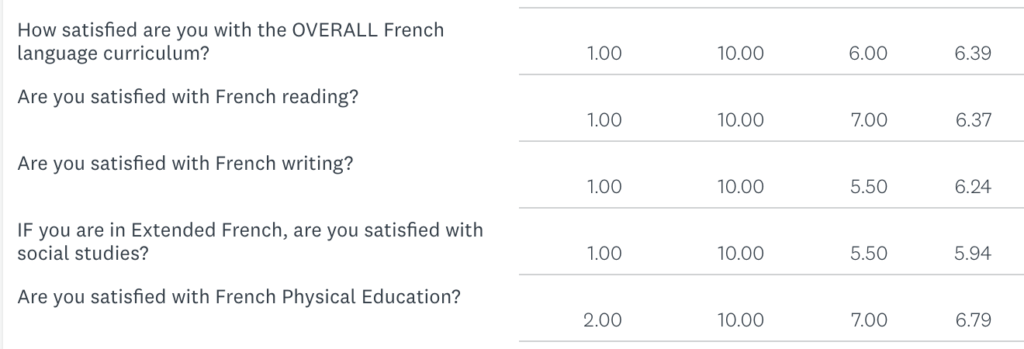
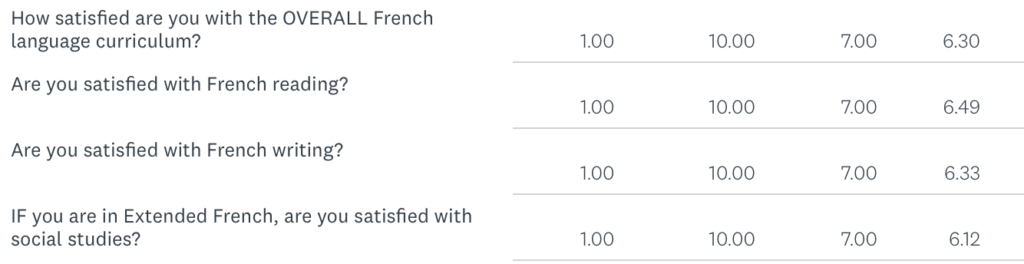
The good news? Every one of these scores is up from last year. The not-that-great news? They are still lower than the acceptable range, although we pleased to see Extended Social Studies zoom over 7.0 for the first time. Improvement? Yes. Real work ahead? Oui.
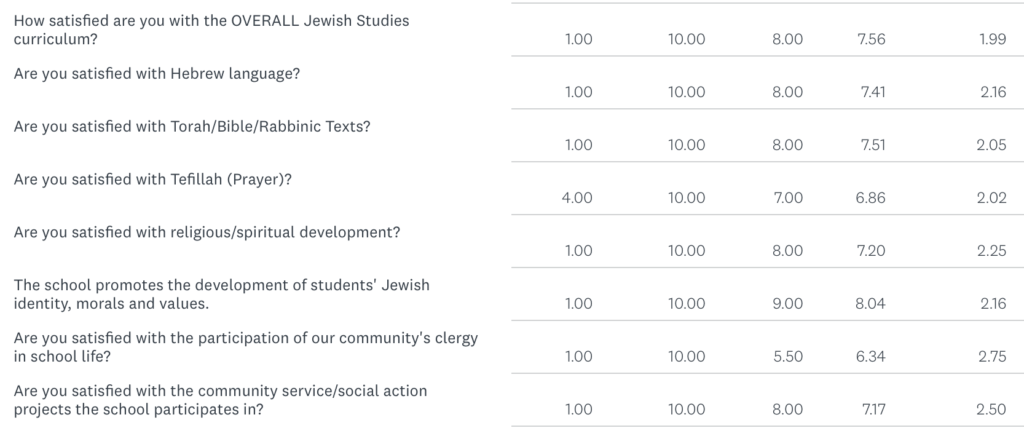
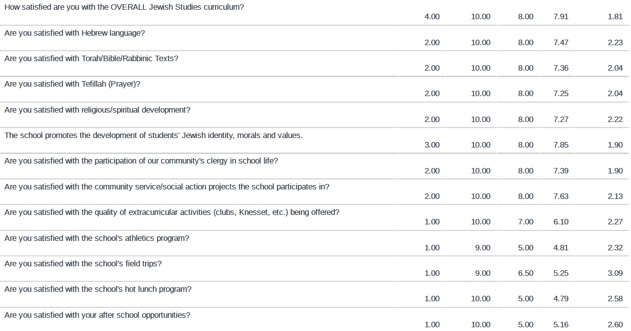
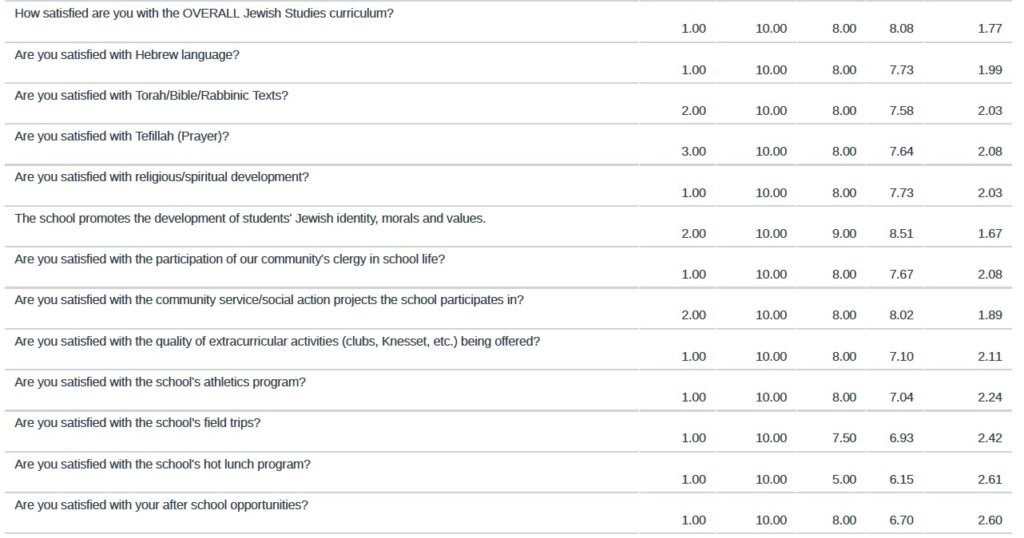
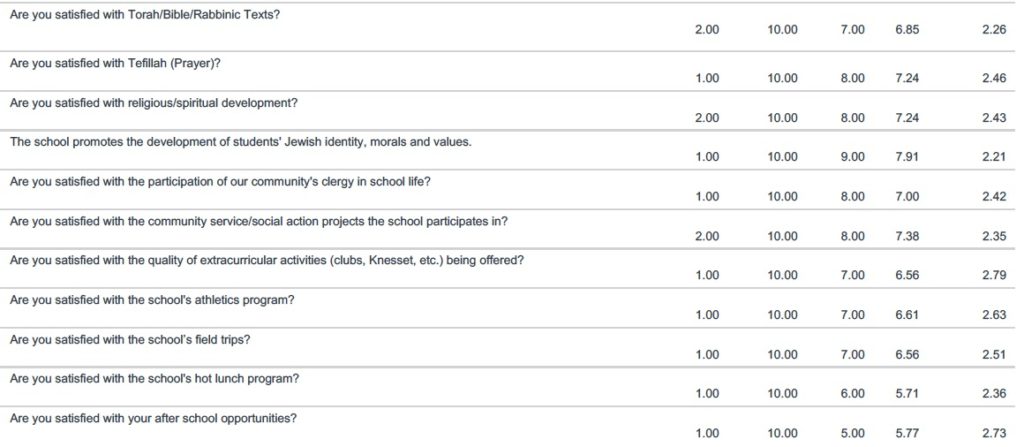
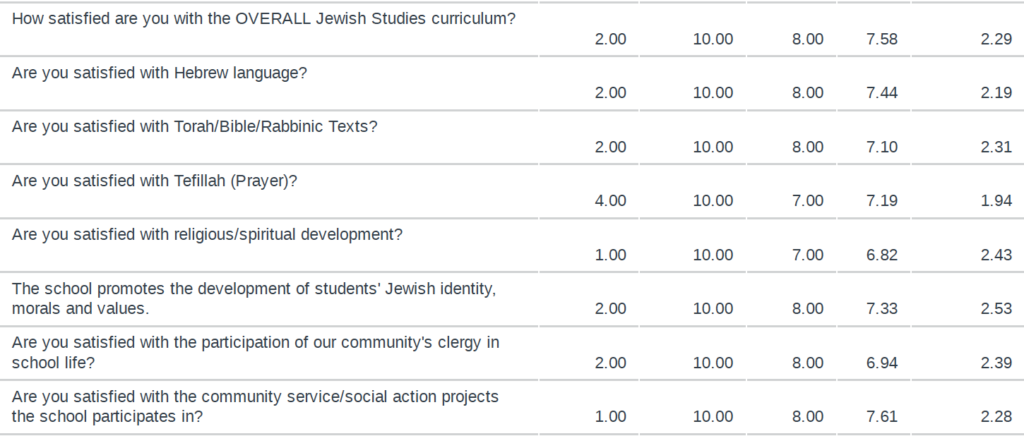
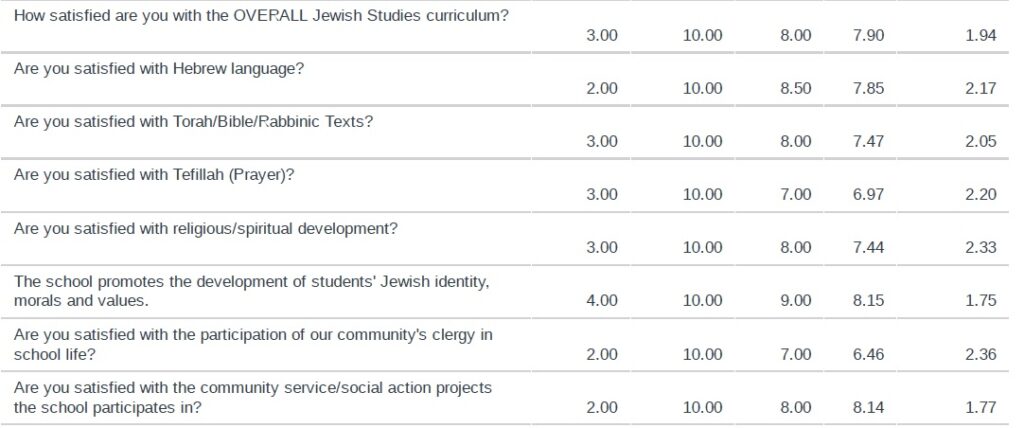
These are great numbers! The only items below the acceptable range is Tefillah which is up from last year and the participation of our community’s clergy, which though important, is not entirely within our control. But this will land on the agenda for the Rabbinic Advisory Committee moving forward.
![]()
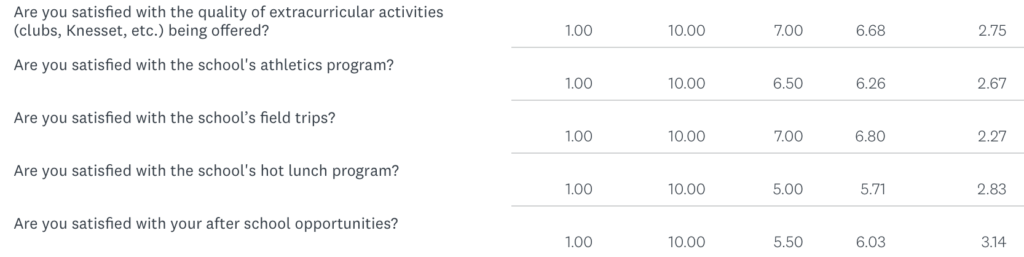
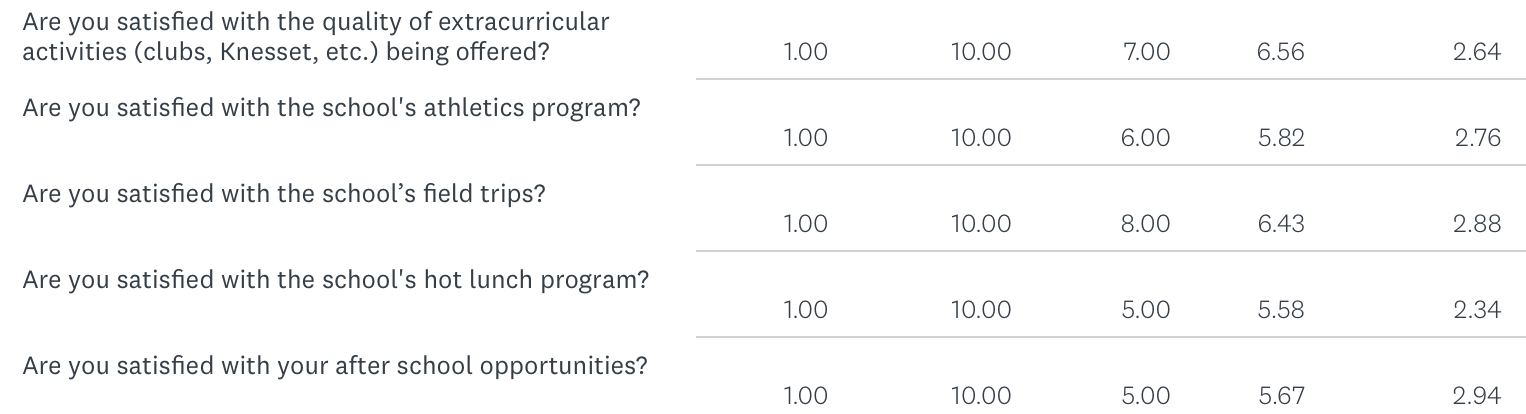
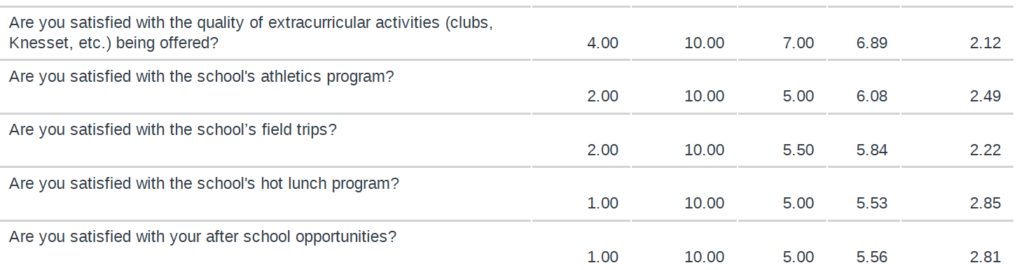
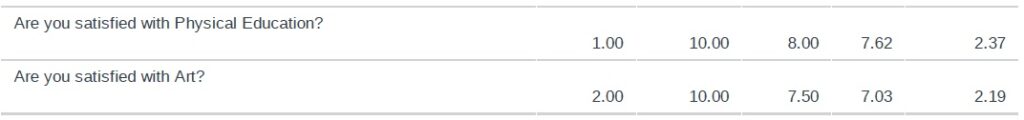
These numbers are all up from last year, but clearly there is work to be done. [A reminder that the addition of Music has not yet made its way into the survey, but is worthy of feedback.] Morah Dina, however, should be proud to see Art surge up over 7.0 for the first time in a long time! There are variables here that are not entirely within our control, but this entire section is worth our thinking more deeply about and identifying a few changes for next year.

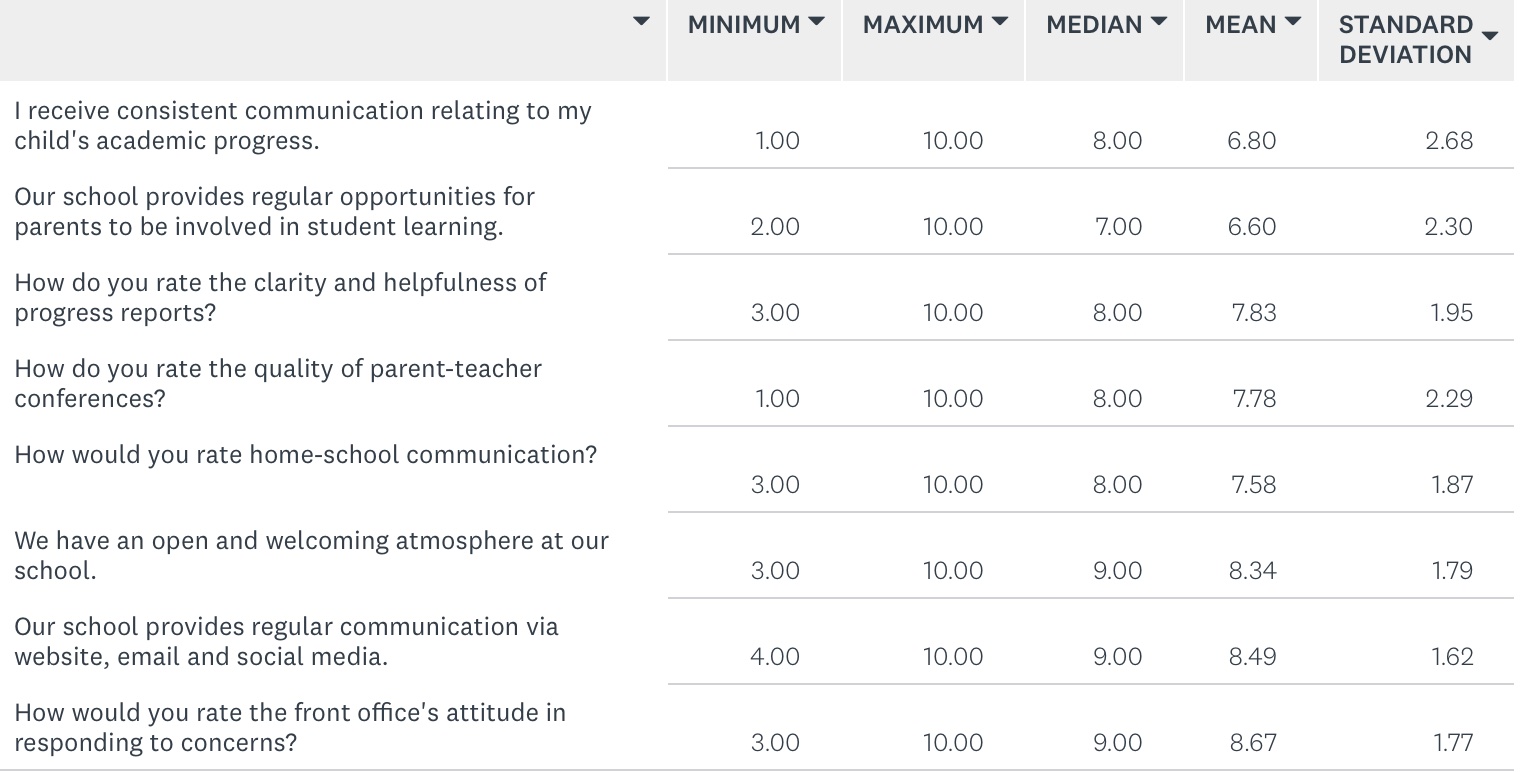
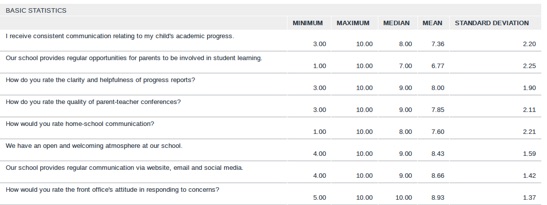
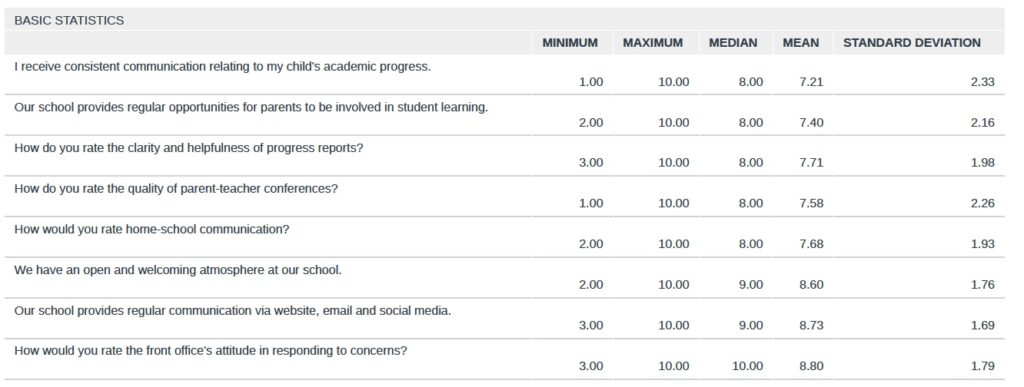
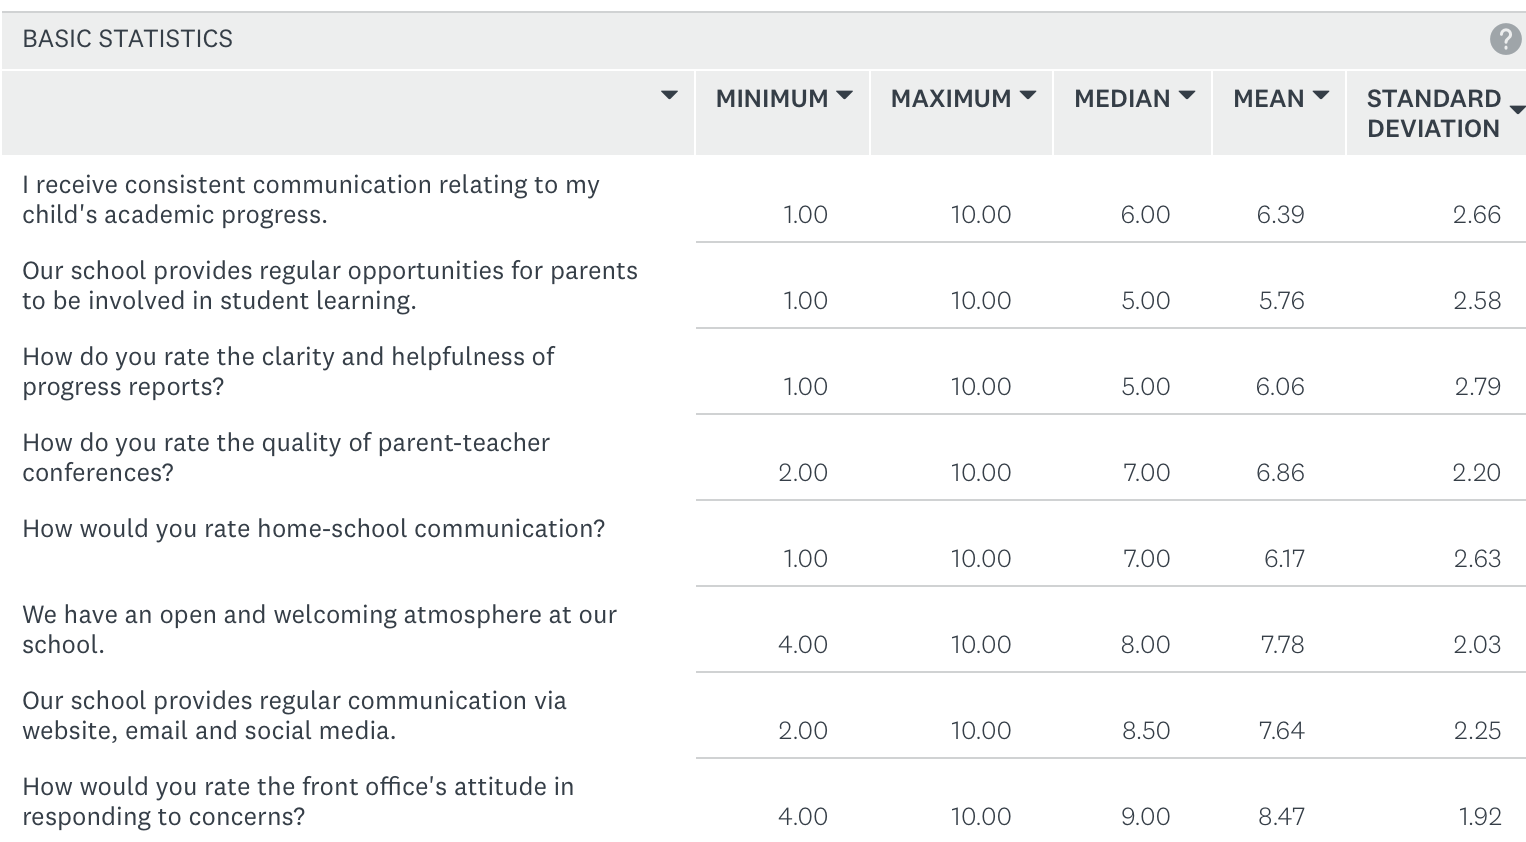
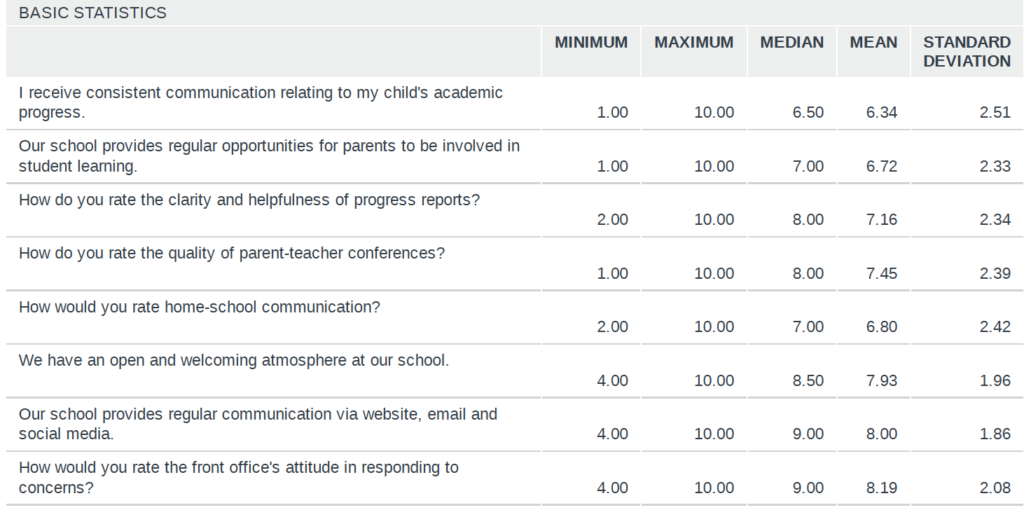
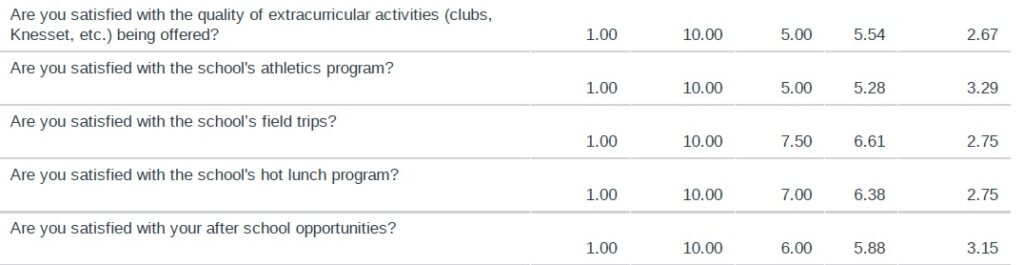
I am pleased to see that all these numbers are up, even the first two which are still technically below 7.0. Paring this with comments, we believe we have made meaningful responses to feedback last year about progress reports, goal-setting, and the transition to semesters.

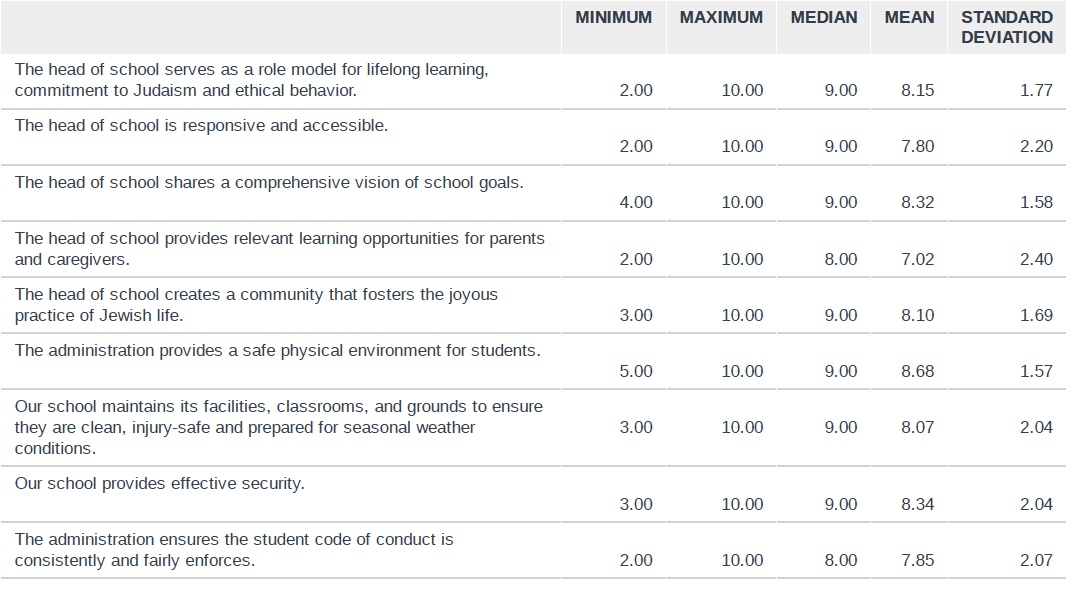
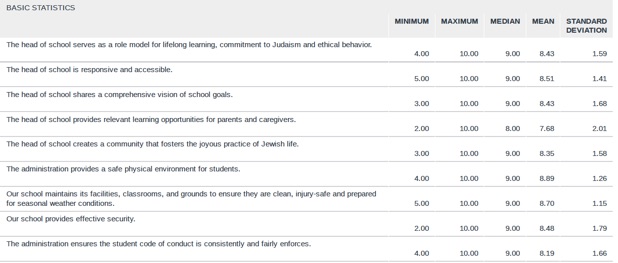
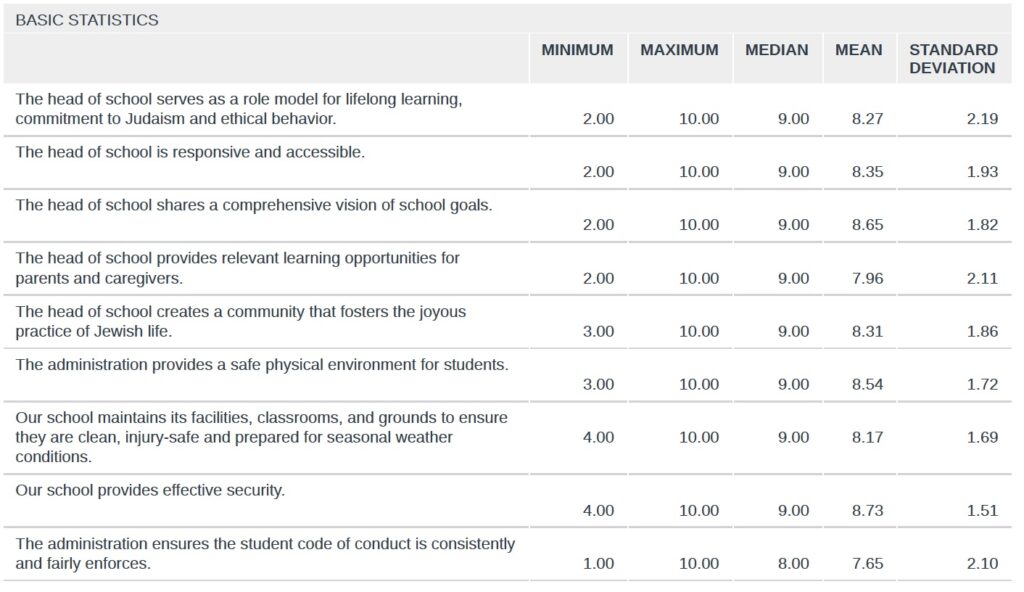
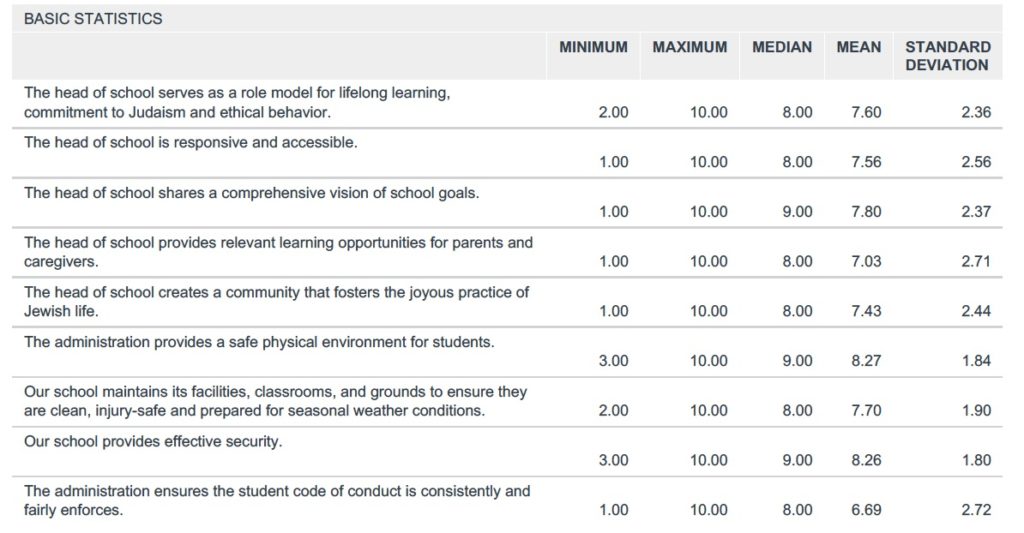
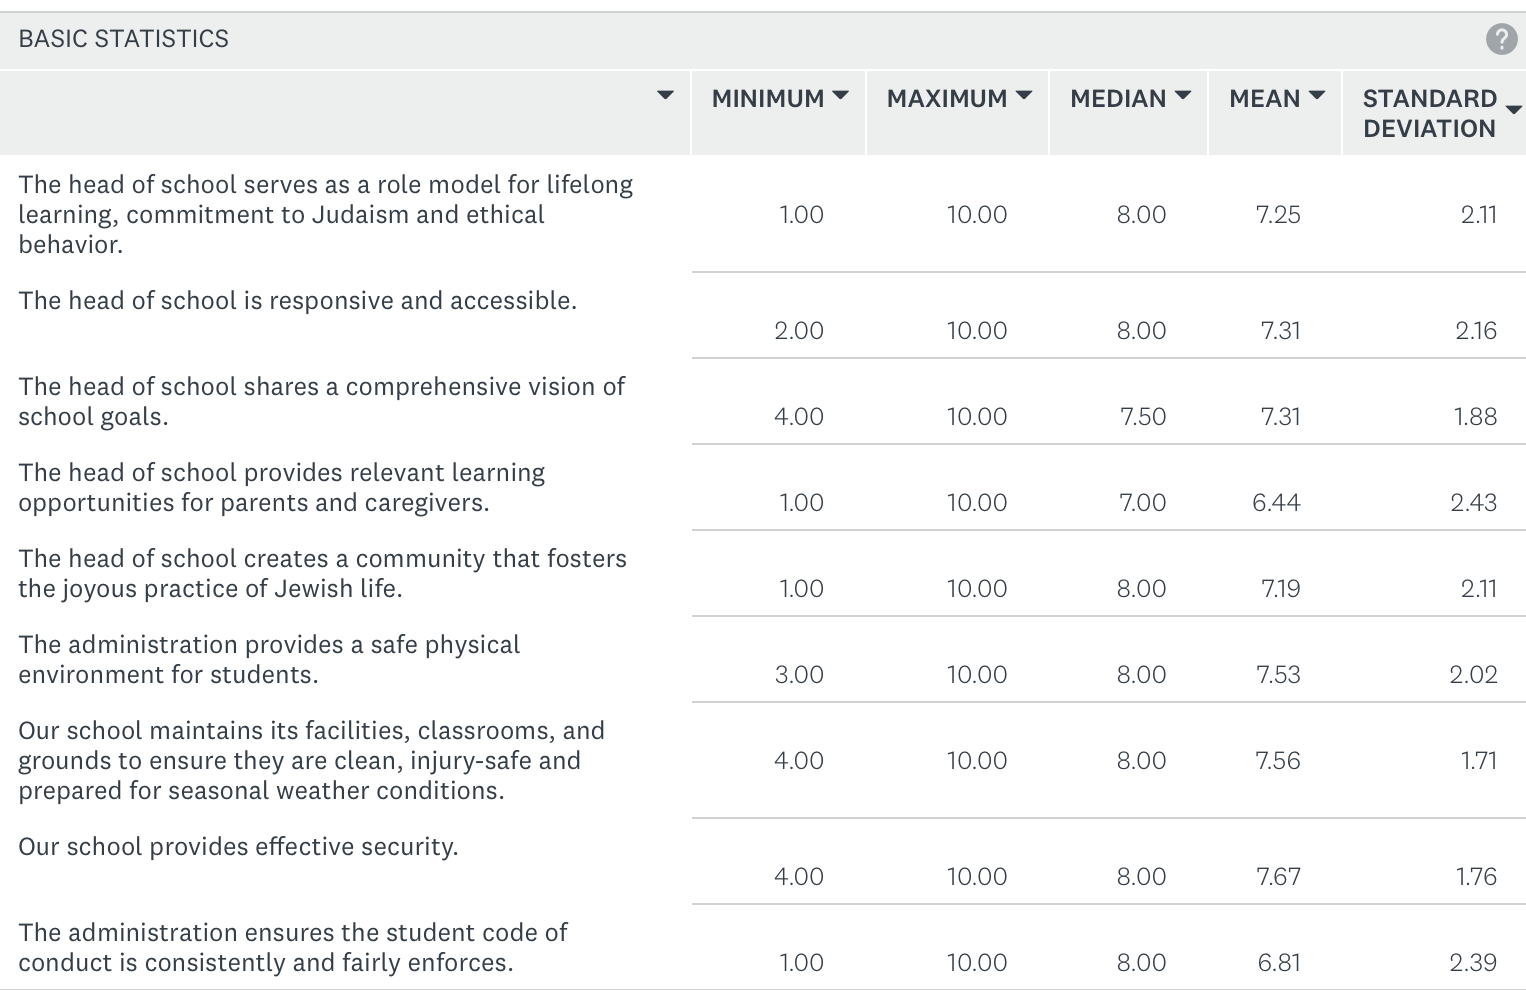
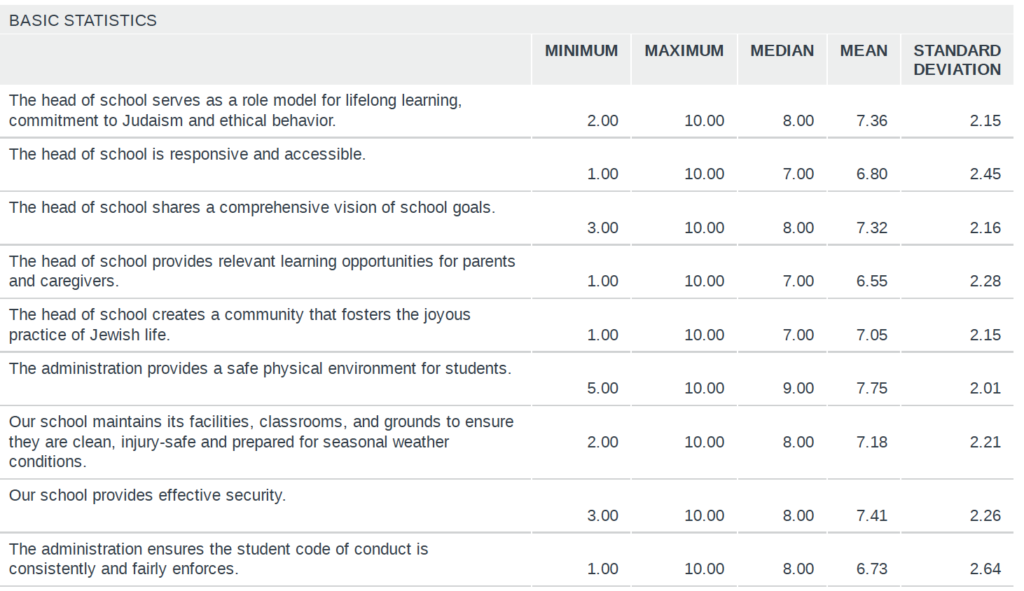
Maybe this is a “goodbye present” or maybe by taking myself out of the survey, the rest of the administration is shining more brightly. 🙂 Either way, these are – by far – the the best scores we have ever received in these categories. Whether it is the renovation, or all the work we have done over the years to improve behaviour outcomes, this is a wonderful result.
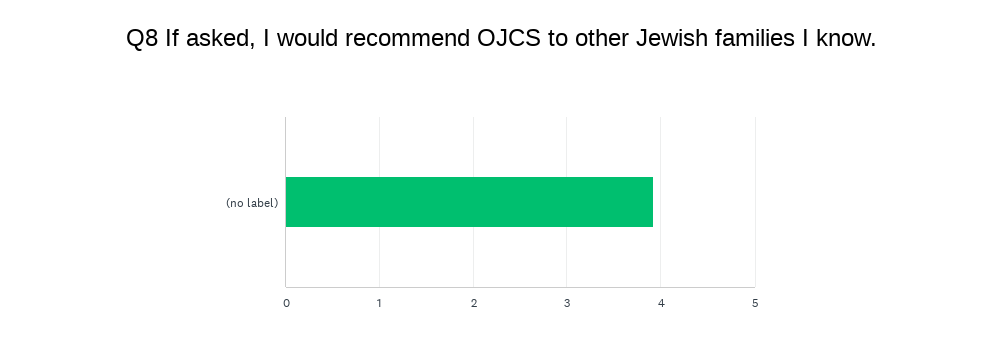
Last data point [Remember this question was scaled 1-5.]:
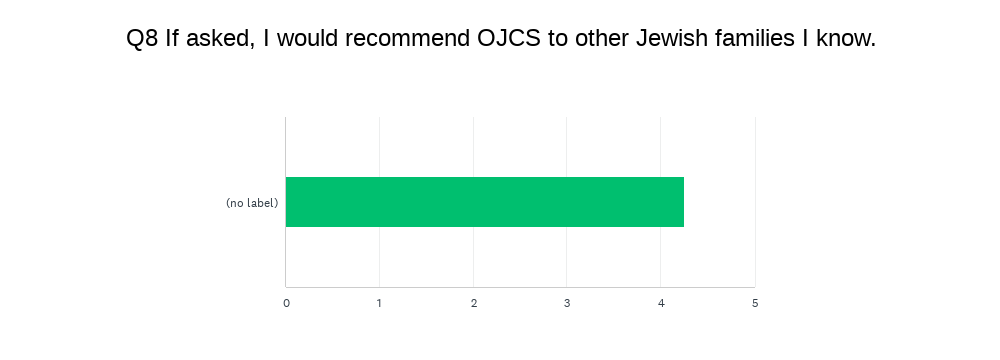
Our score has meaningful recovered from the last couple of dips as the journey has gone from 4.44 to 4.34 to 4.34 to 4.14 to 3.92. to 4.25. This absolutely jives with overall theme of this year’s consistently high scores.
So there you have it for 2024-2025!
Thanks to all the parents who took the time and care to fill out surveys! In addition to the multiple-choice questions, there were opportunities for open-ended responses and a couple of experimental sections. Because the school is in transition, your feedback in those experimental sections counts more than ever. Please know that all comments will be shared with those they concern. (This includes a full set of unedited and unredacted results which goes to our Board of Trustees.)
Eight years. Eight Annual Parent Surveys. There have been zigs and zags, to be sure, but the trajectory has been constant – onwards and upwards. From strength to strength. I look forward to the school reaching even higher heights as the torch is passed to new leadership…
Ken yehi ratzon.

 Without knowing how representative this fifth of students is, this year’s data set is lighter on the “no’s”. Of course the “no’s” are always complicated to unpack because we have no way of knowing who of the “no’s” represent graduation or relocations, as opposed to choosing to attrit prior to Grade 8. However, what continues to be true is that the overwhelming majority of families – regardless of their feedback – stay with us year-after-year. This continues to say a lot about them and a lot about us.
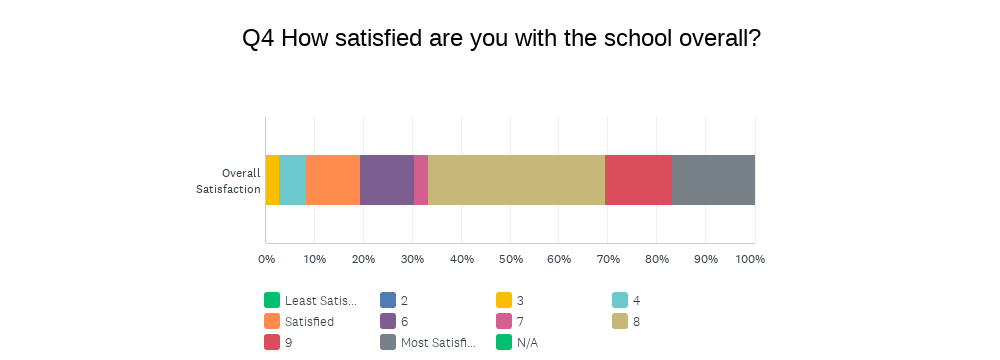
 The first chart gives you the breakdown by category; the second chart gives you the weighted average satisfaction score (out of 10). I will remind you that for this and all categories, I look at the range between 7-9 as the healthy band, obviously wanting scores to be closer to 9 than to 7, and looking for scores to go up each year. In terms of “overall satisfaction”, we have now gone from 7.13 to 7.20 to 8.17 to 7.91 to 8.0 to 7.44 to 7.53. Although it is a tick up from last year, the difference is statistically insignificant.
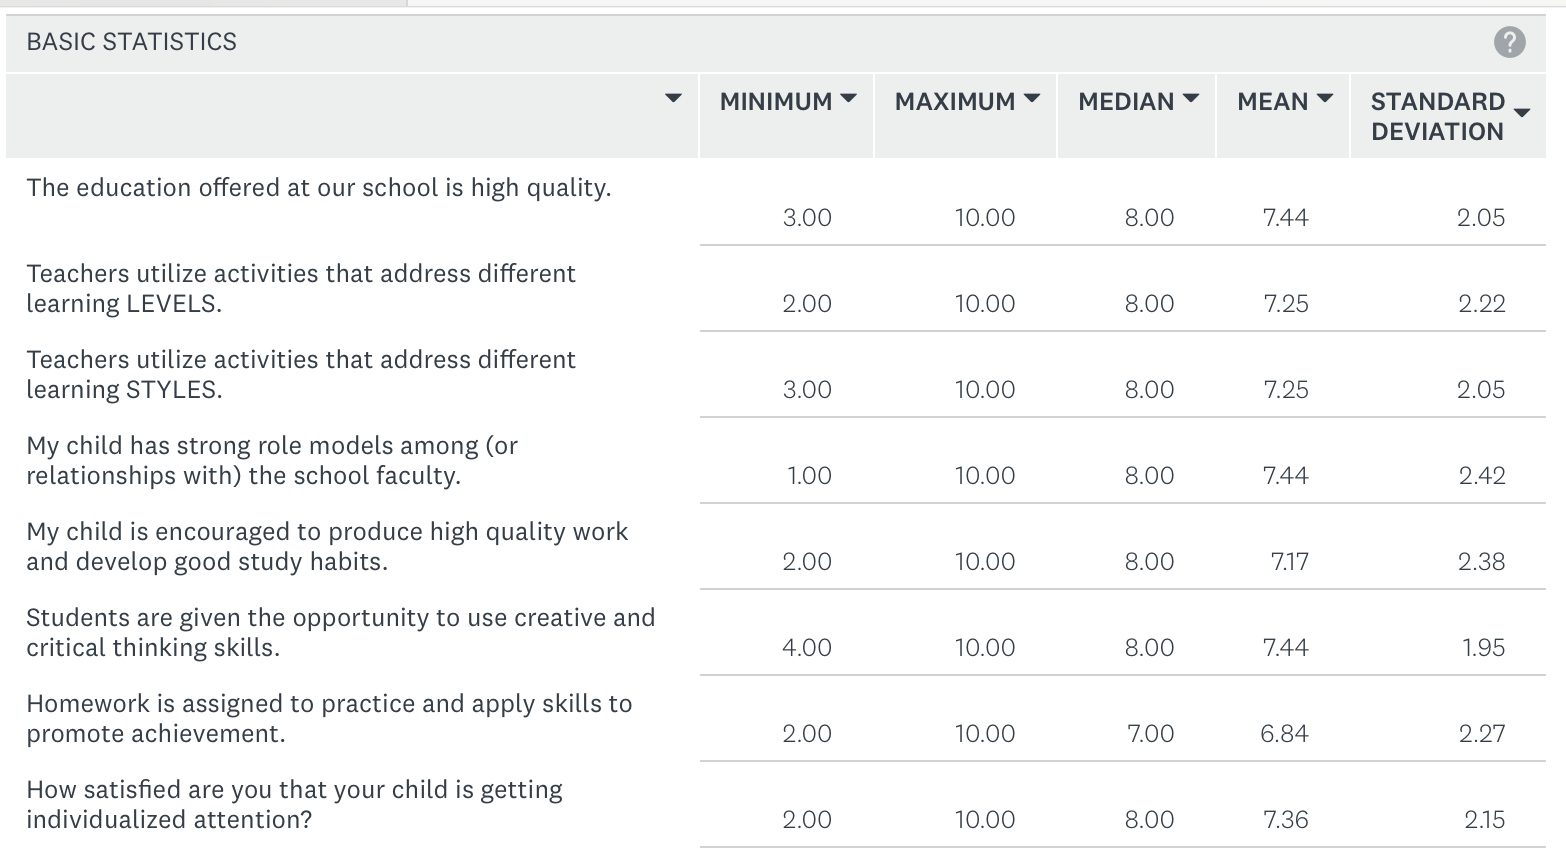


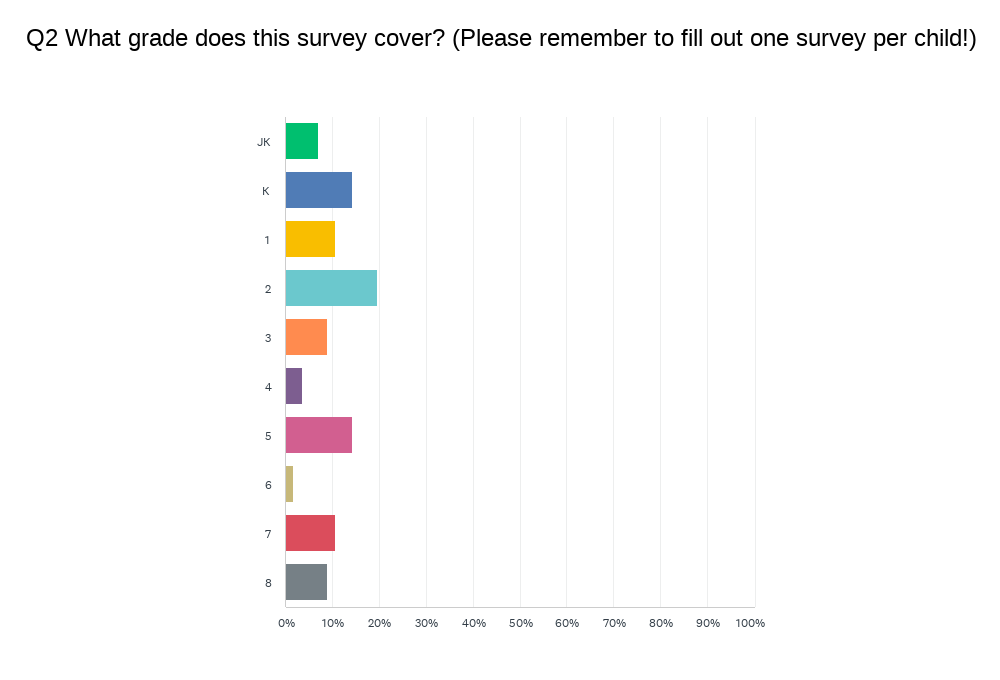 For a third straight year, we have more spread than normal. It is more typical to have a big cluster in the youngest grades with diminishing returns as you get older. Again this year, we have a healthy (if low) distribution across most of our grades.
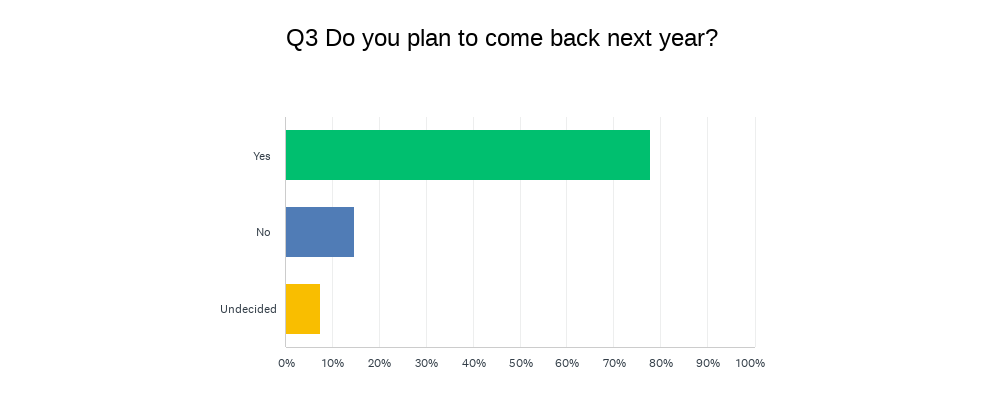
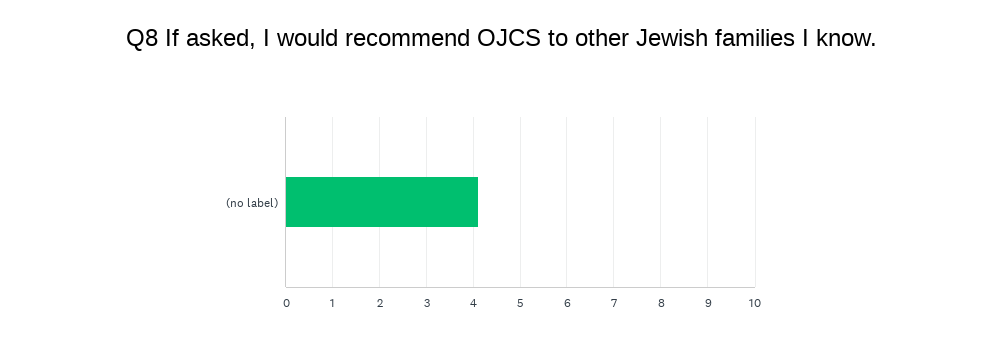
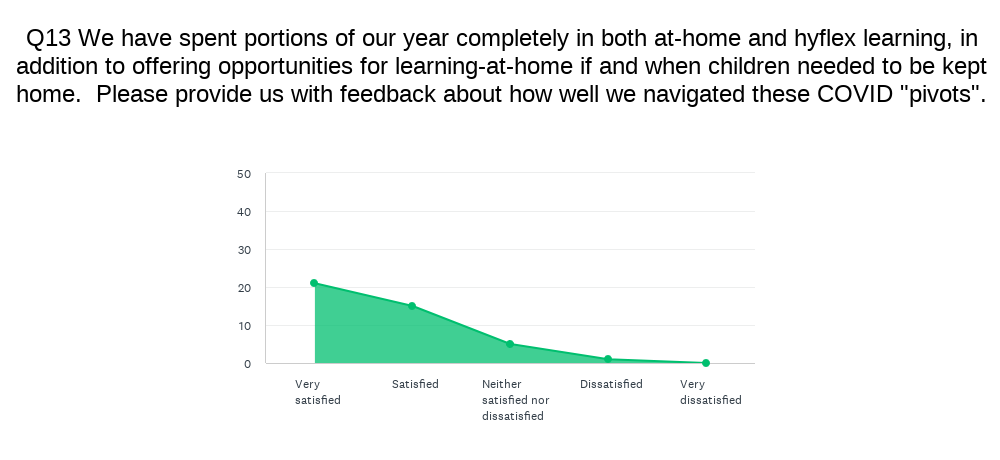
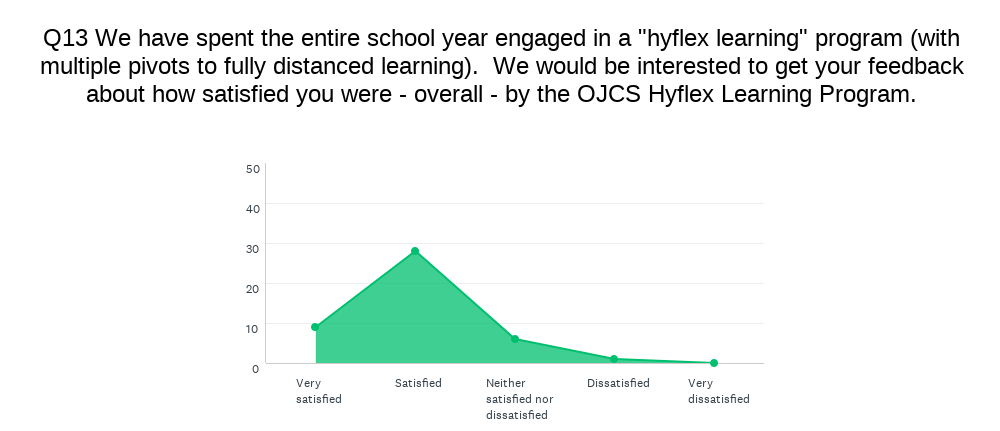
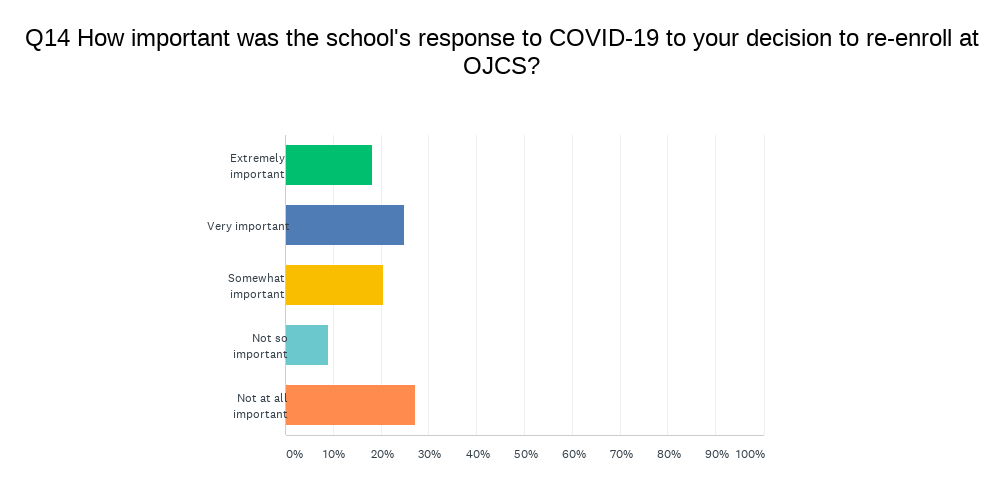
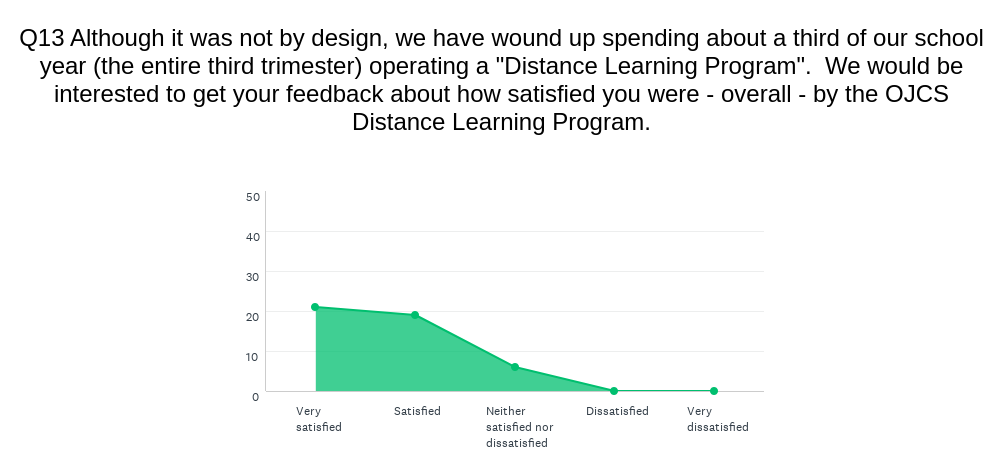
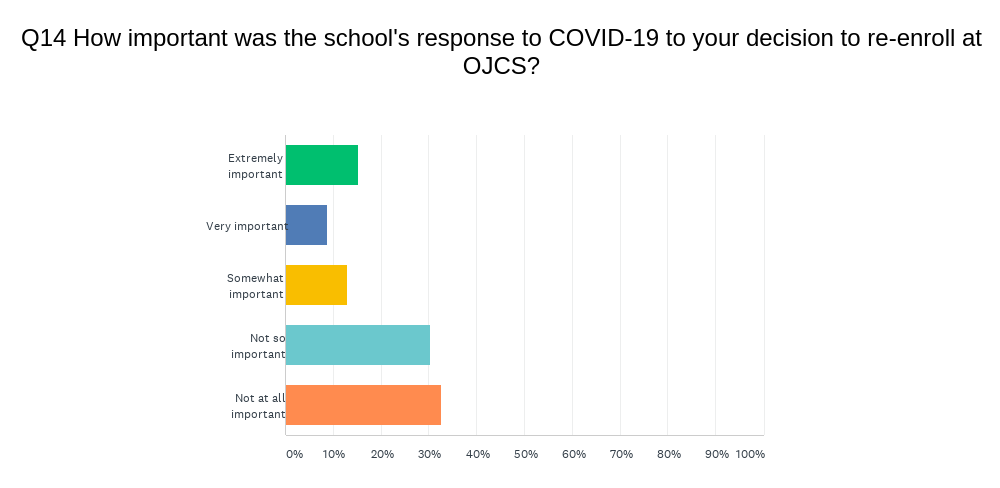
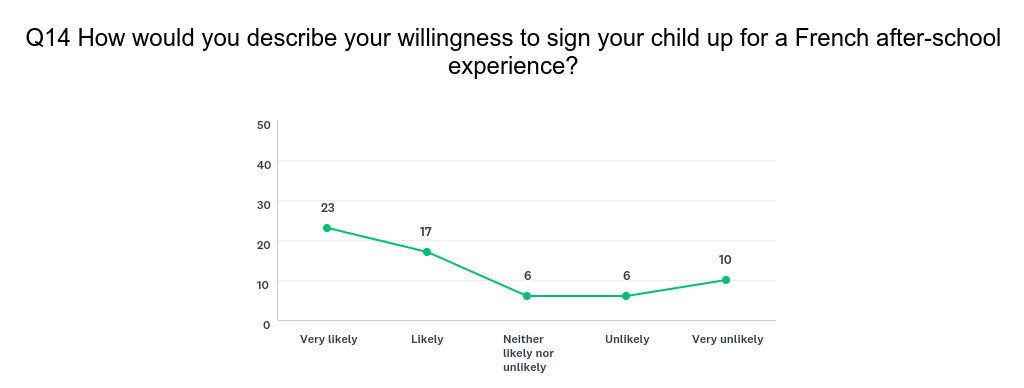
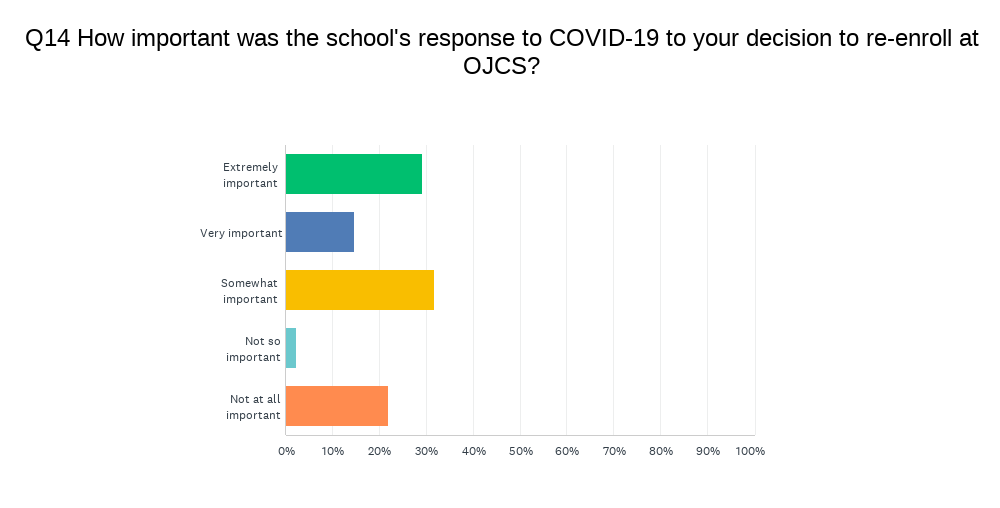 From this year’s experimental section, we yield these two data points (and two sets of meaningful commentary). Compared to last year, there is a larger cluster in “very satisfied” and “extremely important” – which is likely not a coincidence. As we cannot predict the future, even with wholehearted hope of a return to year-round, in-person learning next year, our ability to navigate situations like these last few years with minimal disruption and maximal academic progress – not to mention the continuance of meaningful Jewish experiences – will likely continue to be powerful value-adds for OJCS in the years ahead.