
After making transparent the results of my own evaluation by both myself and my faculty, it is time to turn to our other annual survey: the Annual Parent Survey.
For comparison sake, please know that I do have results from the former version of the survey and will do my best to highlight any trends I see, as well as indicate anything of import in this year’s survey.
It is hard to get an exact read on turn out because we changed from one survey per family to one survey per child. We do know that 81 students are represented in this survey, which is just a bit over half. We will use that baseline moving forward and hope to get closer to 70-80%. Why do some families choose not to provide feedback (in this forum)? Families could be thrilled with what’s going on! (I’d love to vote for that one!) Families could be resigned that the results are not taken seriously enough to invest the time in. Hopefully, when people begin to see more links between the feedback they provide and meaningful improvement in the school it will inspire a greater rate of return. In the meanwhile, even if validity is somewhat challenged, we operate here with a spirit of curiosity and believe we can learn from whatever there is to learn…so…let’s move on to the results.
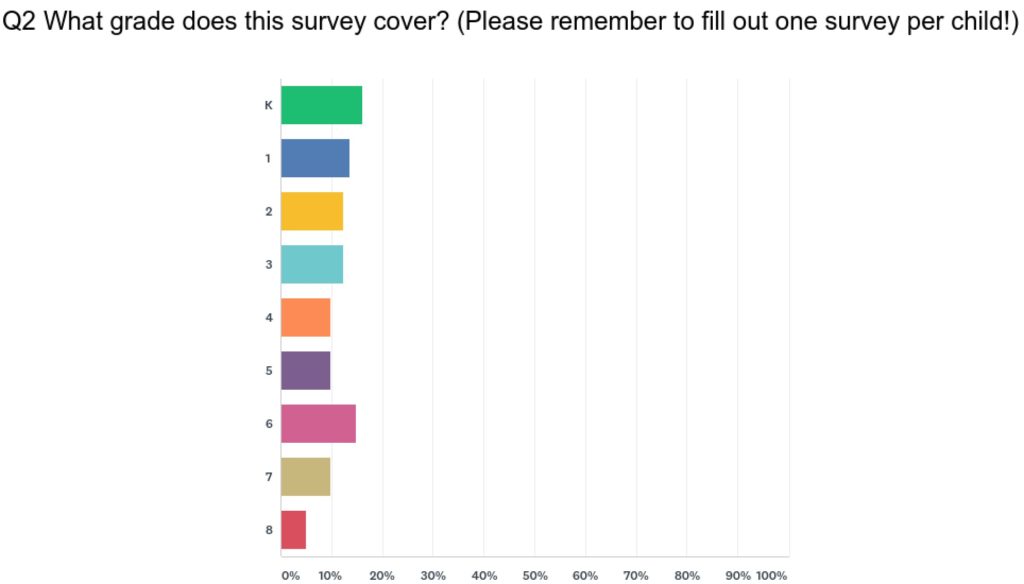
From my experience, it looks mostly how you would expect. There does tend to be diminishing enthusiasm for surveys as the students move on, but great job Grade 6 parents!
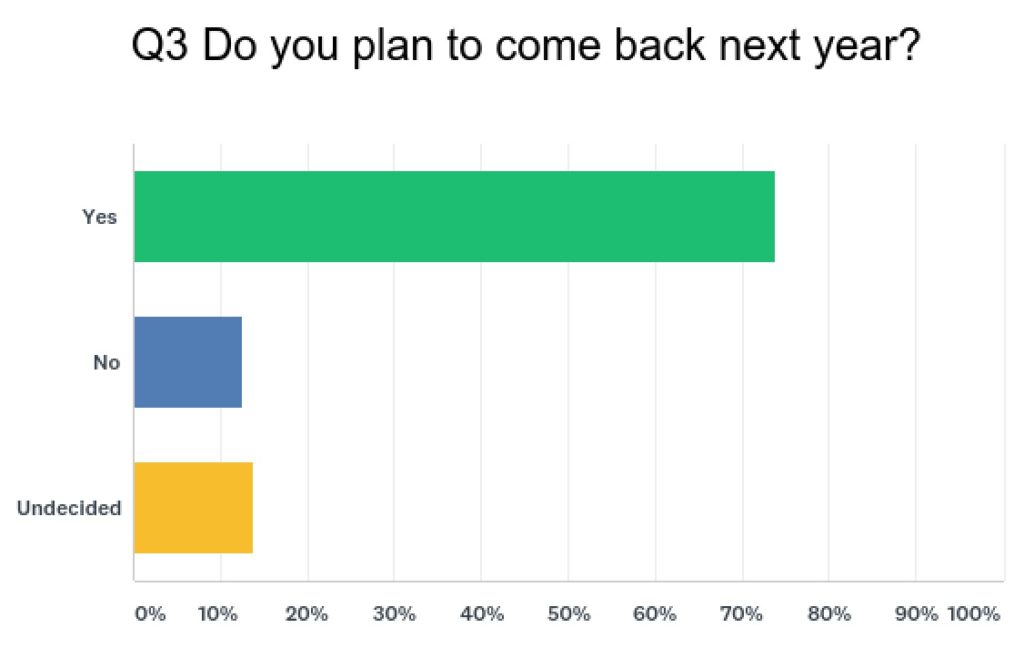
I wasn’t sure whether to include this data point as I didn’t want to be biased by it – all the feedback is meaningful. That is why we conduct exit interviews with each family who chooses to leave OJCS prior to graduation – we are genuinely interested in their feedback. I could have conducted an analysis where I separated the feedback between these three categories, but I have chosen to look at the results as a whole so as not to dismiss any piece of feedback because a family may or may not be continuing.
Let’s look at the BIG PICTURE:
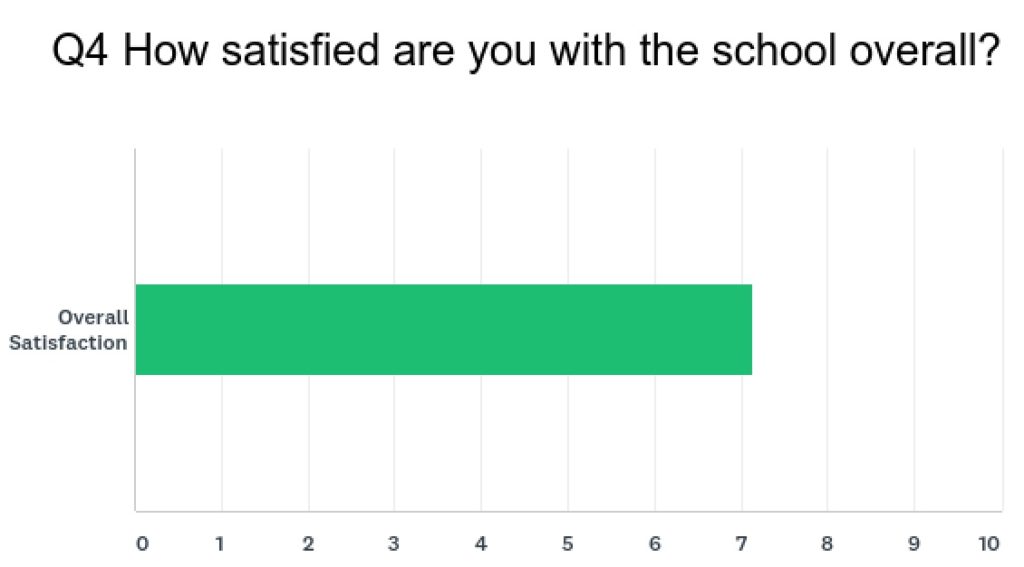
Is that good? I don’t have the exact same question from prior surveys to give you comparison data. I can tell you from having used this survey in other locations, that scores between 7-9 tend to be healthy, and you look at scores below 7 as something you need to pay close attention to (and are thrilled if you ever get a 9 or higher). So landing at 7.13 is technically within a healthy range, but is lower than I would like it. I will definitely be looking to see this creep up in future years. Let’s dig deeper…
These next sections will require a little artful cutting-and-pasting from SurveyMonkey, so I apologize if it doesn’t “look” as professional as I would prefer…the data is still the data.
[Please note that the data is being sliced and diced according to my technical skill, not because there is any particular meaning to the groupings.]
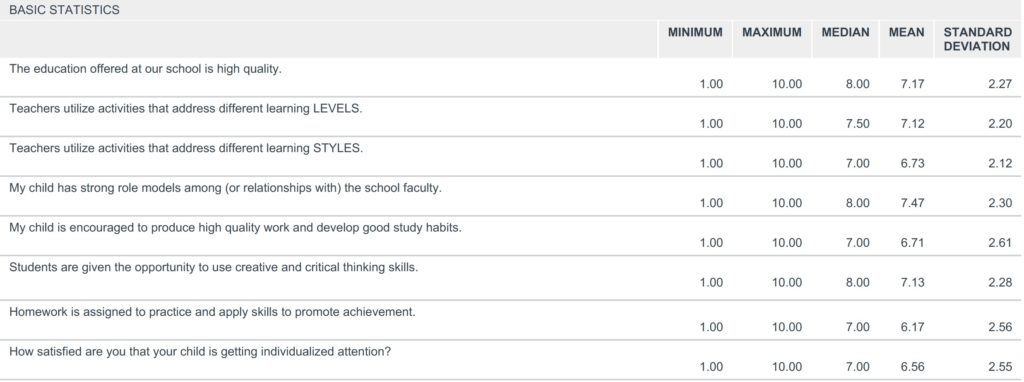
The most important data point here is that our mark for offering a high-quality education is within the healthy range, 7.17. Like above, please know that all our just-barely-above-7 scores are lower than I would prefer and clearly have room to grow.
What jumps out are the ones that fall below 7:
- There is link between “learning styles” and “individualized attention” that really get to the heart of the school we are hoping to become. Our premise of being a school that promises a “floor, but not a ceiling” lives here. I will be surprised if those numbers don’t start to climb as soon as next survey.
- There is also a link between “homework” and “study habits” that we need to pay attention to as well. As we get more clear about what we believe teaching and learning should look like in school, we will also need to have an important conversation about what we think it should look like at home.
It is really important to name that not having comparison data makes it hard to identify trends. So I see these numbers as pretty upsetting – and they are – but I don’t know if they reflect progress.
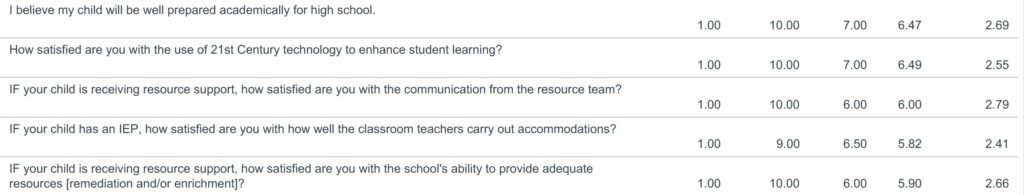
- Preparing children for high school is our number one responsibility; less than a 7 is not going to cut it.
- I’m not pleased with the score for “21st century technology” as it seems to be a step down from last year’s results (at least when compared to a question about “technology”), but as this is my area of expertise, I do feel confident that these numbers will climb next year.
- Considering how hard we try to accept and accommodate children with exceptionalities, it is genuinely disheartening to see these numbers so low. I think if we are being honest, the shakeup of the administrative team from last year to this has hurt our school. We went from having a full-time, qualified special needs professional to divvying up responsibilities across multiple people and it left us a bit shorthanded. This will be addressed next year. We also need to provide more training to our faculty on how to make accommodations. We have a strategic goal to be even more inclusive in the years ahead…but we need to make sure we are meeting the needs of the students we presently have.
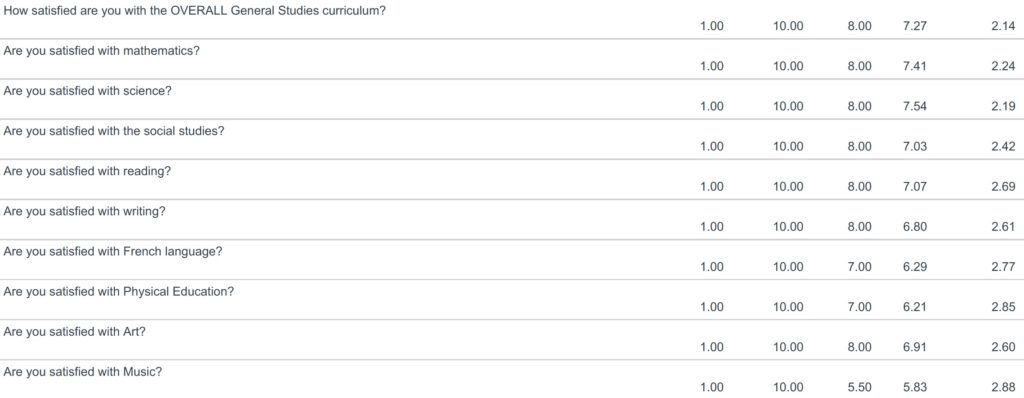
No huge bombshells here and pretty healthy in the core academic areas.
- We are hopeful that the changes we proposed for French (which will be finalized and shared out in our final “Town Hall” – see below) will help the French numbers climb.
- We believe that centralizing the teaching of Art, Music and PE to instructors who are both qualified and focused on their speciality will enhance the quality of all three in the year ahead. These have been perennial concerns.
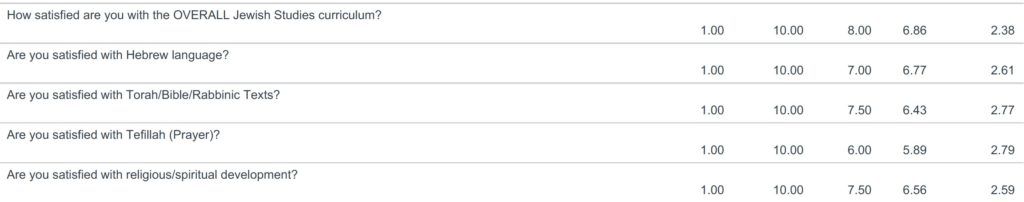
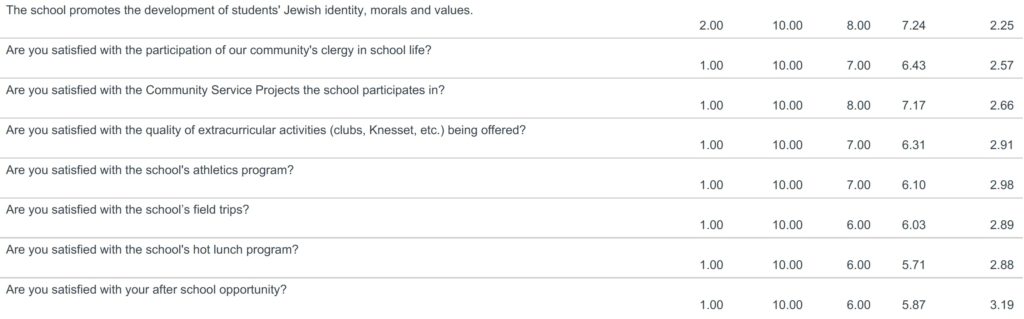
- With regard to Jewish Studies, we know that there is work to do both in terms of academics and experiences. I fully expect that the changes we proposed for Jewish Studies – emphasis on Hebrew fluency, reinstitution of structured tefillah, etc. – will lead to higher scores in the year to come. As a point of reference, this year’s scores are slightly higher than the prior one, which is encouraging.
- More field trips, more consistency with hot lunch, and providing feedback to the JCC about their after school programming are absolutely necessary.
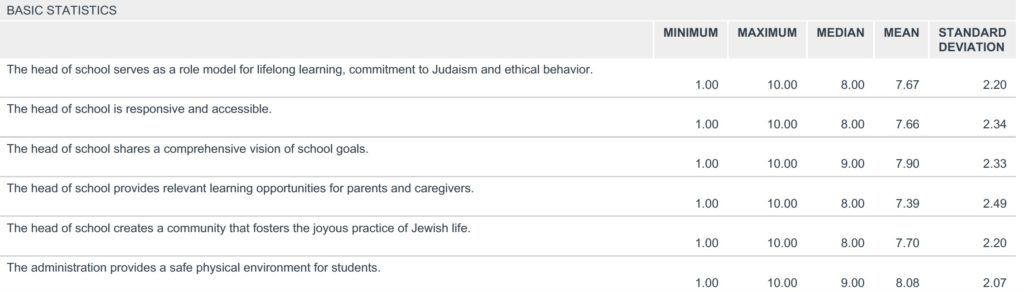
You’ve heard me talk about myself enough by now…
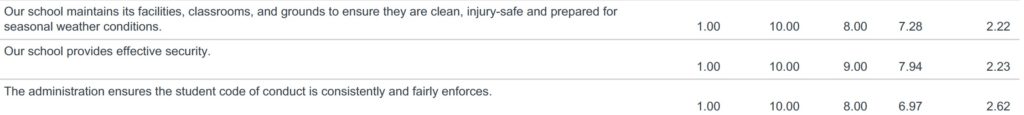
- I will pass the kudos on to our hardworking security team.
- I think we are pleased, but nowhere near satisfied, with the score about student behavior. We believe we have made meaningful progress this year, but are not quite where we would like to be.
Last data point:
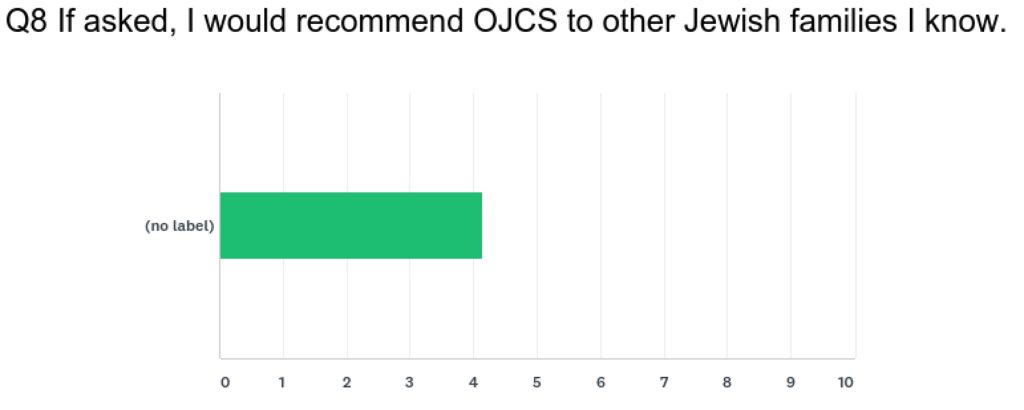
Remember this question is only scaled 1-5! So I am actually pretty pleased to see a 4.14, but like everything else in this survey, we will be looking to see growth in the years ahead.
So there you have it for 2017-2018!
Thanks to all the parents who took the time and care to fill out surveys. In addition to the multiple choice questions, there were opportunities for open-ended responses. They added an additional layer of depth; one which is difficult to summarize for a post like this. But please know that all comments will be shared with those they concern as we use this data to make enhancements and improvements headed into next year. By the by, we are pleased with how well satisfied our parents are with how the school is going…but be assured, just like with everything else, we expect to see growth and progress in a school where there is “a floor, but no ceiling”.
Want a sneak-peek on how we are going to get there?

One thought on “The Transparency Files: Annual Parent Survey”
Comments are closed.