
Looking out my daughter’s bedroom window – as this is where I now work from, when I work from home – at the empty sunny streets, is both a reminder of what is presently true and a foretaste of what we all hope will shortly become true, the first stirrings back towards normalcy. As atypical as this year has been, we do find comfort in familiar habits and experiences. And so if it is mid-May, it must be time to share the results of this year’s Annual Parent Survey. If you would like to see a full comparison with last year, you can reread those results or have them open so you can toggle back and forth. In this post, I will try to capture the highlights and identify what trends seem worth paying attention to.
The first thing to name, which does not come as a tremendous surprise considering the times we are living through, is that we continue to have a less-than representation. The only good news here is that we have at least stabilized a bit. We have gone from 81 students to 84 students to 54 students to 58 students. With increased enrollment, it essentially holds steady from last year, with the survey representing no more than a third of our student population. As the survey is per student, not per family, it runs the risk of being even less representative than that. (In the service of anonymity, we have no way of knowing how many families the survey actually represents.) We had set a goal of 50% and we have a long way to go. If you have feedback on what might incentivize greater participation, please drop it in the comments or email it to us directly.
Of course, this is definitely not an “all things being equal” circumstance. This is definitely not a year for drawing any meaningful conclusions about participation rates. Whereas it is common wisdom that folks with concerns are usually more likely to fill out these surveys, there is no common wisdom when it comes to pandemic times. So for what we hope is just one more year, instead of worrying about the motivations for why families did or didn’t fill out surveys, let’s celebrate the parents who did participate and try to make meaning of what they are telling us.
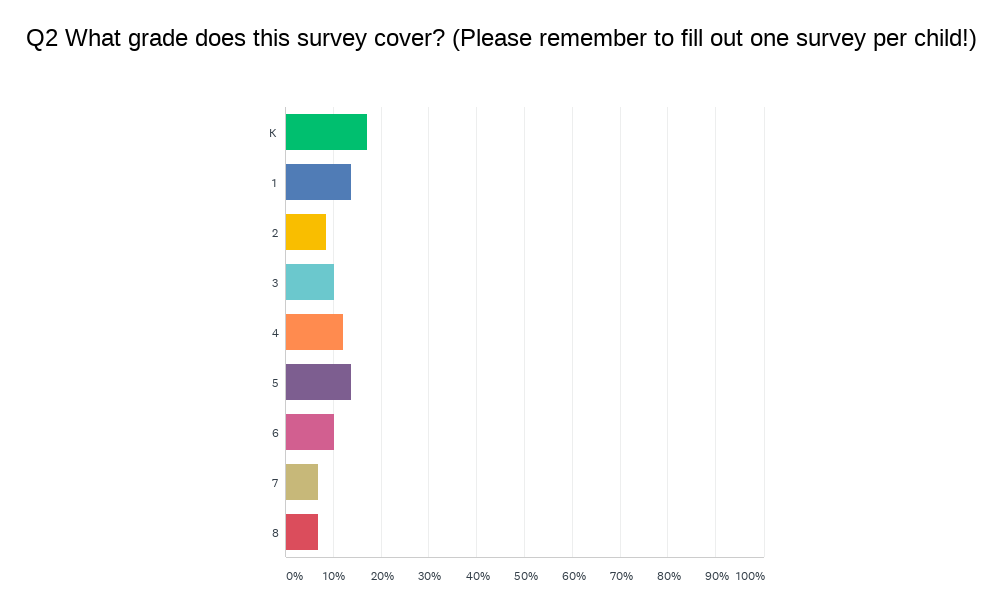
Interestingly, we have more spread than normal. It is more typical to have a big cluster in the youngest grades with diminishing returns as you get older. This year, we have a healthy distribution across most of our grades.
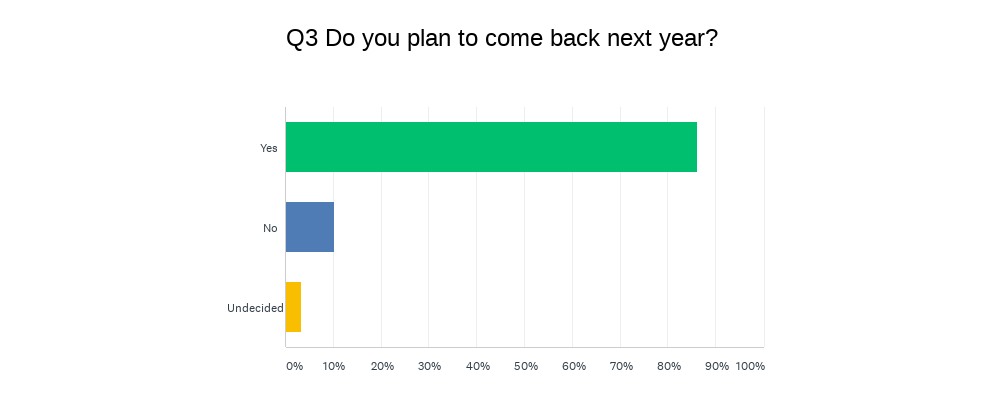
Without knowing how representative this third of students are, this data for sure lines up with what is true – that we have had the fastest and most successful re-registration in recent history! The percentage who replied “yes” is up and the “nos” are always complicated to unpack because we have no way of knowing who of the “no’s” represent graduations or relocations, as opposed to choosing to attrit prior to Grade 8). What continues to be true is that the overwhelming majority of families – regardless of their feedback – stay with us year after year. This continues to say a lot about them and a lot about us.
Let’s look at the BIG PICTURE:
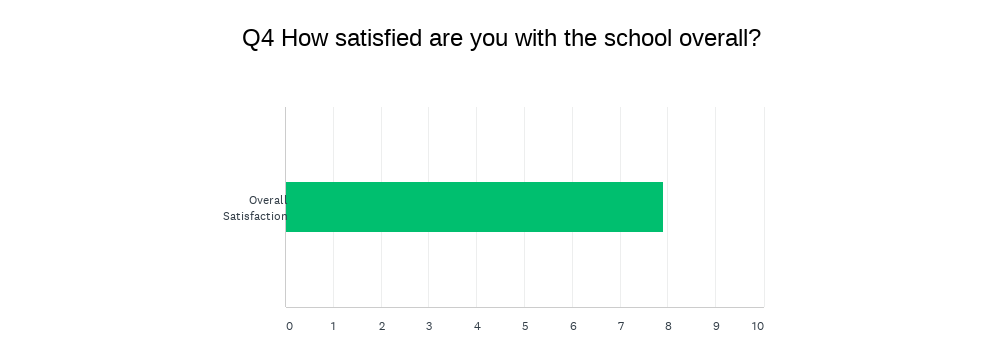
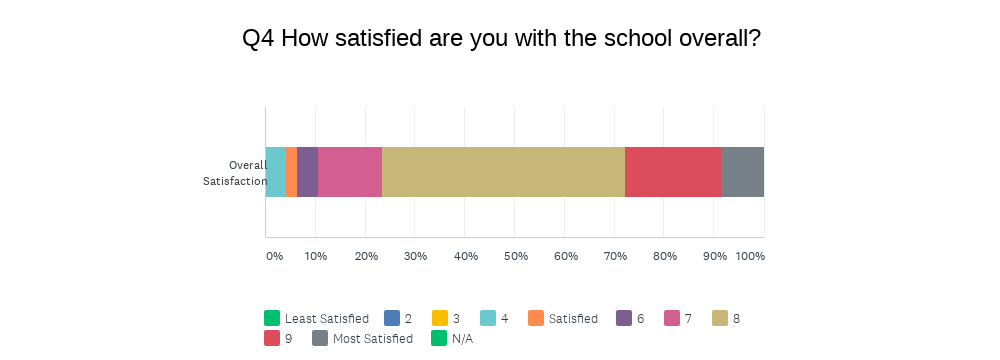
The first chart gives you the weighted average satisfaction score (out of 10); the second chart gives you the breakdown by category. I will remind you that for this and all categories, I look at the range between 7-9 as the healthy band, obviously wanting scores to be closer to 9 than to 7, and looking for scores to go up each year. In terms of “overall satisfaction”, we have now gone from 7.13 to 7.20 to 8.17 to 7.91. Although it is just a tick down from last year, the difference is statistically insignificant. Interestingly, this is the first time that no families graded the school a 1, 2 or 3. Of course, we always want to see numbers go up, and not down, but based on how we survey it is hard to get much higher.
This continues to be a good news story, but let’s dig deeper…
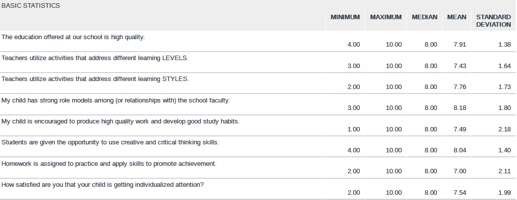
[Please note that if it is little blurry, it is how I have to cut-and-paste-and-scan the data. Hopefully, you can zoom in a bit more if you need.]
- The topline number – probably the most important – like our overall satisfaction is barely down from 8.0 to 7.91 and a very positive outcome.
- I am very pleased to see that every single category is essentially unchanged from last year’s all-time highs and that for the first time each score is in the healthy range!
- I am thrilled to see that relationships with faculty comes in with the highest score (8.18) in this block, especially when you factor in all the challenges this year of pandemic have created. Kudos to our teachers!
- Our lowest score (again) is again in “Homework” but it continues to climb from 6.56 to 6.91 to 7.0, putting it inside the healthy band for the first time. Progress has been slow, but we are seeing steady improvement in the full implementation of our new Homework Philosophy.
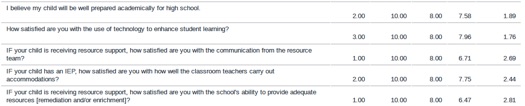
- We have seen steady growth on the topline number, which again is so critical to our school from 6.61 to 6.97 to – finally! – jumping up to 7.58! I wonder if having a higher percentage of families with older children and/or a percentage of families joining OJCS from other schools moves the needle? It could verify that parents’ perceptions of their child(ren) as being well prepared for high school grows higher as they get closer (which would be good) to graduation.
- The metrics for Spec Ed are a bit of mixed bag with the communication score dipping down a bit, but the satisfaction score for those who have IEPs jumping up meaningfully. The numbers remain strong and of all the things to suffer during the pandemic, it is not surprising to see it impact our most vulnerable students. Kudos to Sharon Reichstein, our Director of Special Needs Education, and her team for all their work this year!
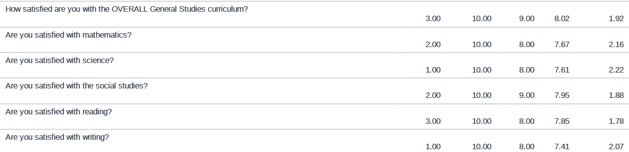
- Thrilled to see that our topline number continues to remain over 8!
- Very happy to see that every metric in General Studies is well into the healthy band and each one is essentially unchanged.
- Math: 7.09 to 7.60 to 7.67.
- Science: 7.09 to 7.72 to 7.61.
- Social Studies: 7.41 to 7.96 to 7.95.
- Reading: 6.93 to 8.0 to 7.85.
- Writing: 6.51 to 7.07 t0 7.41.
- The biggest movement, which I am very pleased to see, is in “Writing” where we have, not coincidentally, a number of teachers spending what bandwidth for professional growth they have available on increasing rigor in our writing program. This is a clear example over time where parent voice, aligned with teacher and student voice, leads to meaningful action. (Fill out those surveys y’all! We really do pay attention.)
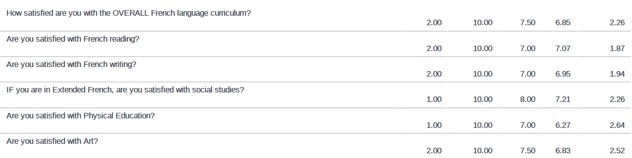
- I am so pleased to report that (if you allow for just a hint of rounding) not only are all our metrics up, but French at OJCS has finally fully entered the healthy band! That’s fantastic news! Our OVERALL metric went from 5.66 to 6.54 to 6.85. French reading grew from 5.58 to 6.36 to 7.07. French writing went 5.35 to 6.07 to 6.95. To what can we attribute this growth? Two things leap out: 1) The addition of three new, high-quality French Teachers and, 2) The impact of our final year of consultancy with TACLEF. When you factor in how hard it has been to integrate the work of the consultancy to hyflex and distance learning, it makes the achievement all the more significant. There is still room to grow, of course, but four years in, perhaps we can finally say that the narrative around French outcomes at OJCS has finally shifted. Bon travail to the French Department!
- Sticking with the theme of this section, it is not surprising with all the protocols that were in place that we’d see dips in both Art and PE. We’ve made it hard for those teachers to deliver their usual excellence and in that context, their scores can be interpreted to be quite positive. We know that even with a rigorous, trilingual curriculum, that we need to continue to offer the kinds of high-quality PE/Music/Art experiences that make a well-rounded education. Look for these numbers to go back up next year.
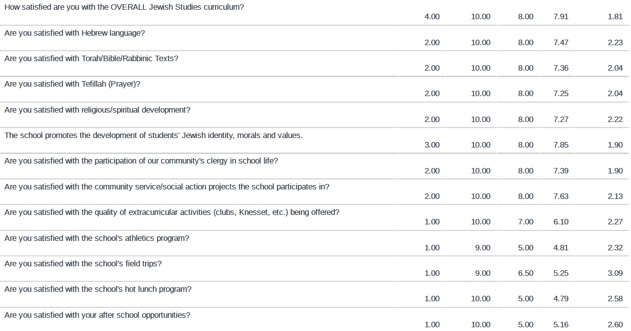
- We are again thrilled to see all our Jewish Studies metrics continue to hold strong for another year. We are especially pleased to see the OVERALL metric essentially hold steady from 7.29 to 8.08 to 7.91. Considering, that we went forward without filling the “Dean of Judaics” position and all the additional COVID-related challenges, this is especially encouraging. Kol ha’kavod to the Jewish Studies Department!
- We have tried really hard not to let COVID be the excuse throughout the course of the year, but when it comes to the rest of the categories in this chart, it is hard not to. These scores are way lower than normal, but unless they stay there again next year, I am inclined to view them a COVID blip.
- Similarly with “Hot Lunch,” between COVID and the change in status for Creative Kosher, one expects us to be better prepared next year and I’ll look for this score to return to normalcy.
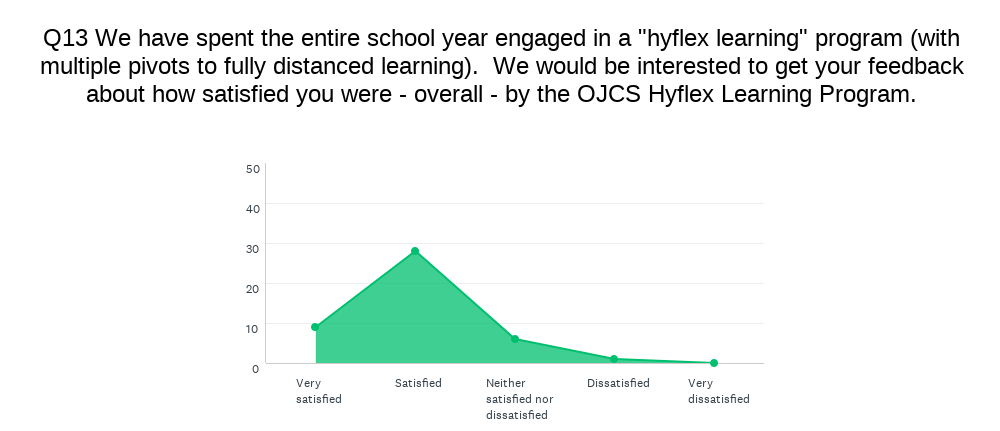
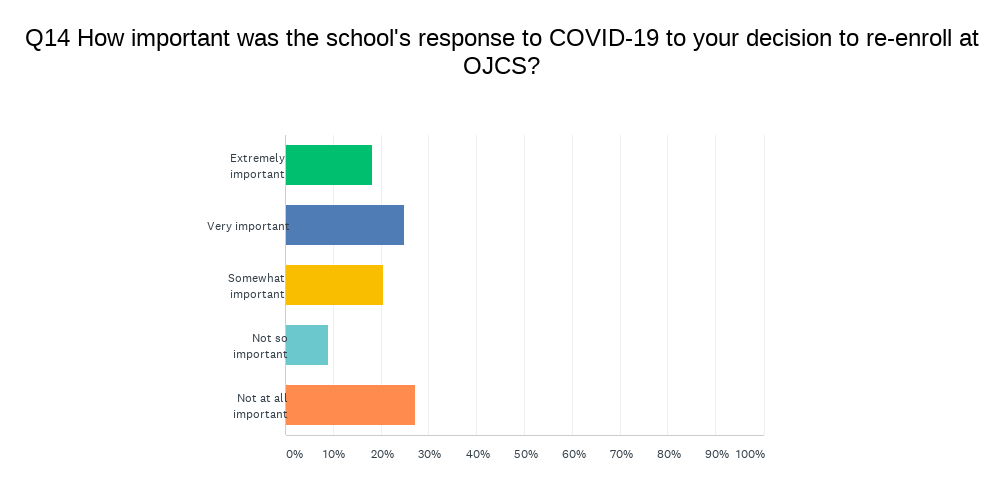
From this year’s experimental section, we yield these two data points (and two sets of meaningful commentary). As we cannot predict the future, even with wholehearted hope of a return to year-round, in-person learning next year, our ability to navigate situations like this with minimal disruption and maximal academic progress – not to mention the continuance of meaningful Jewish experiences – will likely continue to be powerful value-adds for OJCS in the years ahead.
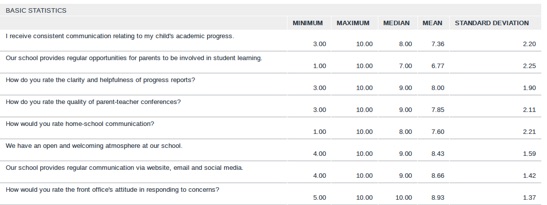
- These are wonderful scores, all a bit higher than last year and all well into the healthy band! We know that we have Ellie to thank for a lot of those high scores!
- After having to take a COVID pause, I will be interested to see what the impact of “Student-Led Conferences” will be on the “parent-teacher conferences” metric once finally launched.
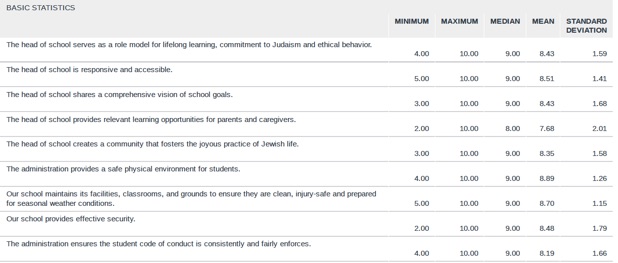
- I have already shared my thoughts on my own job performance in my prior “Transparency Files” post. I will simply state here my pleasure in seeing all these numbers climb from the prior year.
- It is especially heartwarming to see the highest score we have ever registered, 8.89 (!), for providing a safe environment. That, more than anything, is the story of the year.
- The one metric that I am very pleased to see continue to climb is the last one, which essentially serves as a proxy for school-wide behavior management. Two years we scored a 6.69 and I stated that, “we are working on launching a new, school-wide behavior management system next year based on the “7 Habits” and anchored in our “North Stars”. I will be surprised if this score doesn’t go up next year.” Well, last year it came in at 7.65 and this year it climbed up to 8.19.
Last data point:
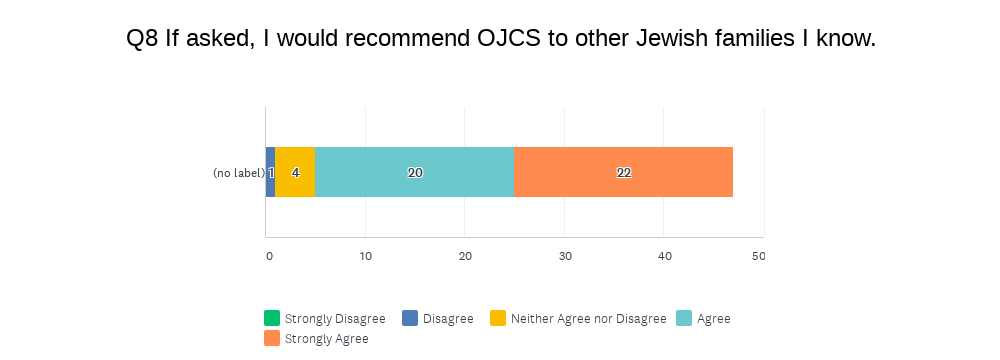
Remember this question was scaled 1-5. Our score remains consistent from 4.44 to 4.34. I said last year, that I truthfully don’t know how much more there reasonably is to grow this, but we’ll keep doing our best to find out!
So there you have it for 2020-2021!
Thanks to all the parents who took the time and care to fill out surveys! In addition to the multiple choice questions, there were opportunities for open-ended responses and a couple of experimental sections. Your written responses added an additional layer of depth; one which is difficult to summarize for a post like this. Please know that all comments will be shared with those they concern. (This includes a full set of unedited and unredacted results which goes to the Head Support and Evaluation Committee of our Board of Trustees.) As you can see, we really do use this data to make enhancements and improvements each year.
We very much wish to continue into next year, this year’s trend in increasing positive outcomes and satisfaction. To mix school metaphors, each year simply becomes the higher “floor” we stand upon to reach towards our North Stars. With no ceiling, we aim to reach a little closer each time.