The Transparency Files: Annual Parent Survey

It is that time of year again…but, perhaps, it may not continue to be “that time of year” – at least in this format – into the future…

As our enrollment continues to increase and our participation in the Annual Parent Survey continues to flatline – our survey has gone from covering 81 students to 84 students to 54 students to 58 students to 52 students and this year, the majority of questions were only answered by families covering 45 students.  That barely captures one quarter of our student population and it is only fair to ask, at this point, whether or not this continues to be the best way to solicit meaningful and actionable data.  Because that is the reason we do this – to learn how to continue to grow as a school.  Without three-quarters of the students accounted for, the data can only be so meaningful.  Without casting any aspersions about who is, or who is not, more likely to fill these surveys out, the odds of this 1/4 mapping onto the opinions of the remaining 3/4 seems long at best.  As the survey is per student, not per family, it runs the risk of being even less representative than that.  (In the service of anonymity, we have no way of knowing how many families the survey actually represents.)

Our goal of 50% seems more and more unrealistic each year.

So, after this year, we are going to have a think.  We could incentivize families to fill this out, as some parents have suggested.  We could consider moving to a model where we do focus groups some years and surveys other years.  Perhaps if we hired a third-party vendor to issue the survey, analyze the data and share the report, people would be more comfortable believing it is as anonymous as it is (it is!), or have more faith in an unbiased deliverable.  Either way, I think it is time to acknowledge that this methodology is no longer serving its intended purpose and the goals of receiving feedback and sharing it transparently likely require a new approach.

But that’s for next year…for now, instead of worrying about the motivations for why families did or didn’t fill out surveys, let’s thank the parents who did participate and try to make meaning of what they are telling us.  [If you would like to see a full comparison with last year, you can reread those results, or have them open so you can toggle back and forth.  In this post, I will try to capture the highlights and identify what trends seem worth paying attention to.]
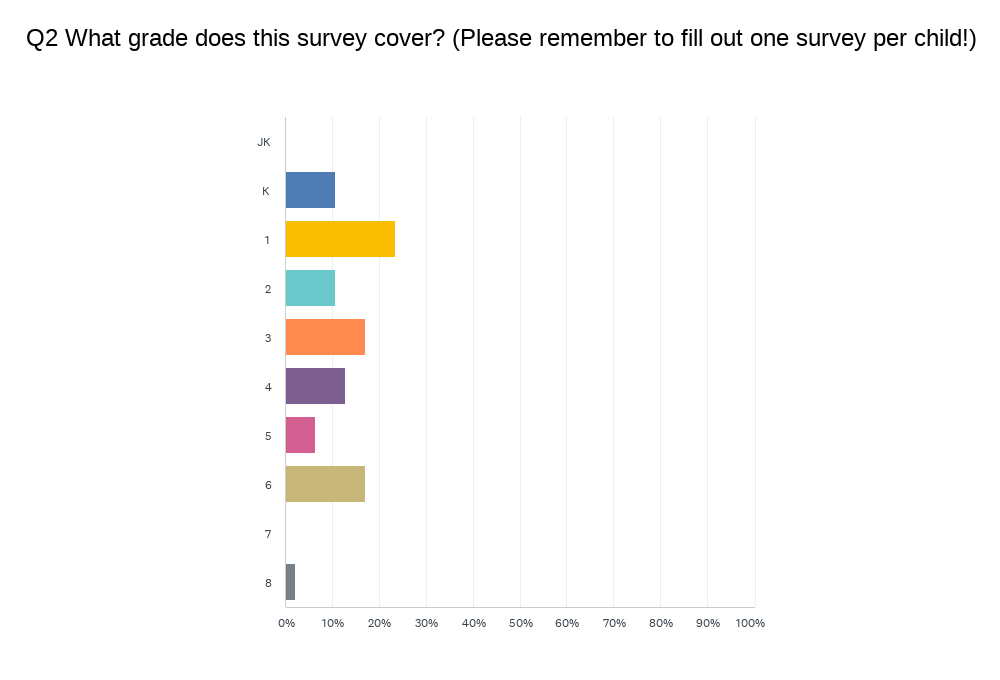
For a third straight year, we have more spread than normal.  It is more typical to have a big cluster in the youngest grades with diminishing returns as you get older.  Again this year, we have a healthy (if low) distribution across most of our grades.

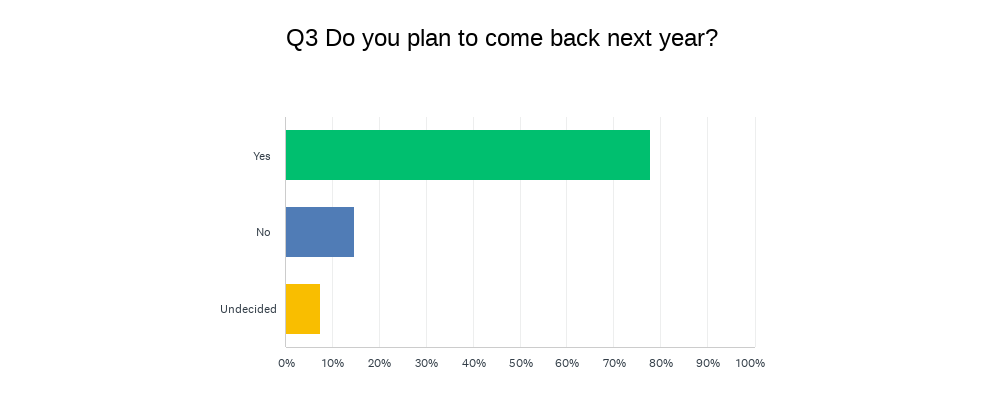
Without knowing how representative this quarter of students is, this year’s data set is heavier on the “no’s”.  Of course the “no’s” are always complicated to unpack because we have no way of knowing who of the “no’s” represent graduation or relocations, as opposed to choosing to attrit prior to Grade 8.  [If a higher percentage of the small number who attrit are represented in these results than in prior years, it would provide added context for the results.]  However, what continues to be true is that the overwhelming majority of families – regardless of their feedback – stay with us year-after-year.  This continues to say a lot about them and a lot about us.

Let’s look at the BIG PICTURE:
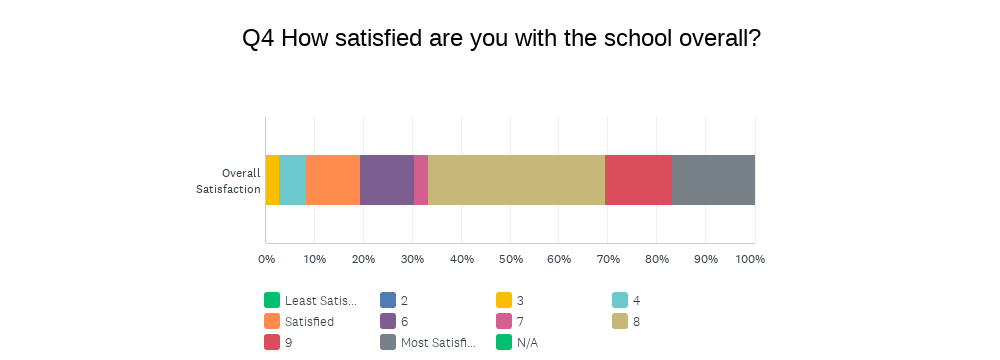
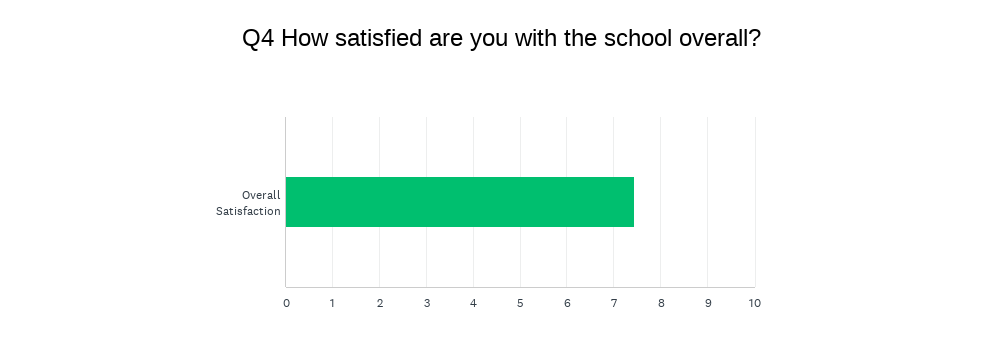
The first chart gives you the breakdown by category; the second chart gives you the weighted average satisfaction score (out of 10).  I will remind you that for this and all categories, I look at the range between 7-9 as the healthy band, obviously wanting scores to be closer to 9 than to 7, and looking for scores to go up each year.  In terms of “overall satisfaction”, we have now gone from 7.13 to 7.20 to 8.17 to 7.91 to 8.0 to 7.44.  Although it is a tick down from last year, the difference is statistically insignificant.

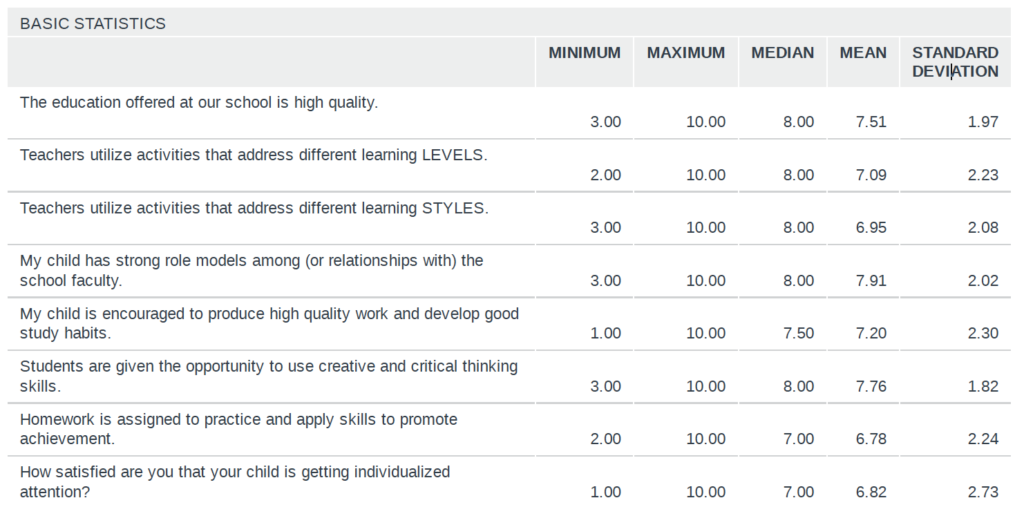
The one thing that jumps out here that will continue throughout all the data is that the “standard deviation” is much higher than in prior years.  Meaning, we have higher concentrations on both ends than normal – which combined with the low engagement probably explains the most about the data above and below.  This 1/4 of the student population could capture more families with the strongest feelings than in a typical year.

However, overall, this continues to be a good news story, but let’s dig deeper…

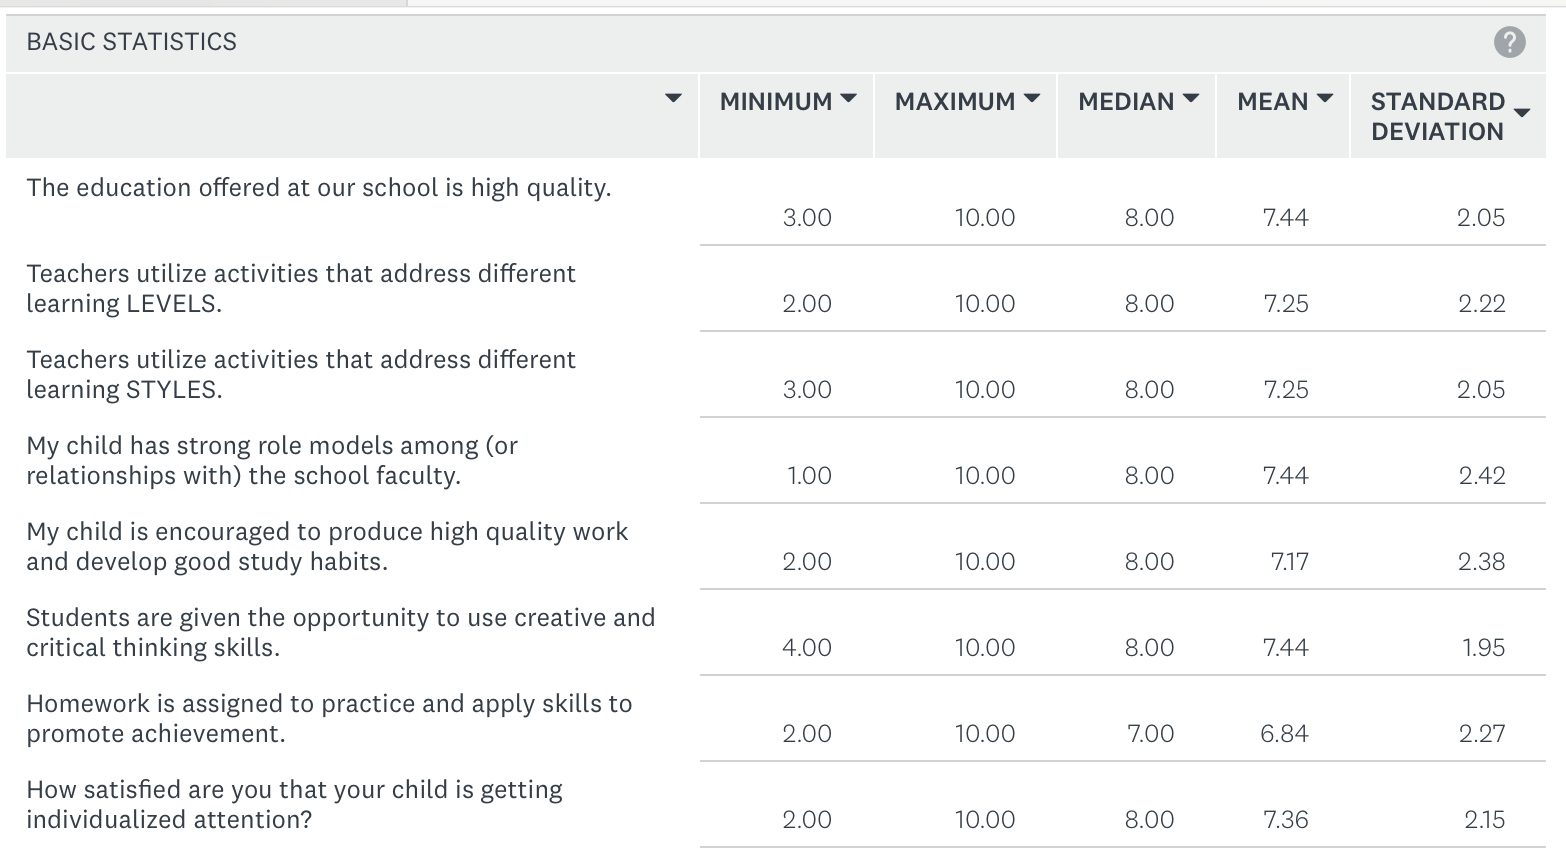
  • The overall theme, which I have been suggesting above and will carry forward is that almost every single category is slightly down.  That is not a trajectory that pleases us, even with all the possible caveats and contexts.  We like numbers to go up; we don’t like when numbers go down.  However, because they are consistent all across the board, it is a bit challenging to identify one issue, program or idea to work on.  I’ll have more to say below.
  • It remains true, however, that even with this disappointing trend line, all data points (here) round into the acceptable range.  So we don’t like the way the arrow is facing, but this constitutes a challenge, not a crisis.


  • I won’t repeat the same comment each time – each score being slightly down, but mostly in the acceptable range.
  • The one thing that jumps out from this, which we know, is that the school has been trying to provide the same level of quality in terms of “resource” with the same staffing structure spread across +40 students.  Meaning, during my six years at OJCS, we have over 40 more students in our school and the same number of personnel allocated to providing resource support – whether that is direct services to students, coaching and support for teachers in making accommodations, or even the customer service of reporting back and forth with parents.  We keep trying to do more with less, and if this data yields anything actionable it is this – even leaving aside potential differences in philosophy; we are not yet adequately staffed to deliver on our promise to parents.

Action to follow.  Watch this space.


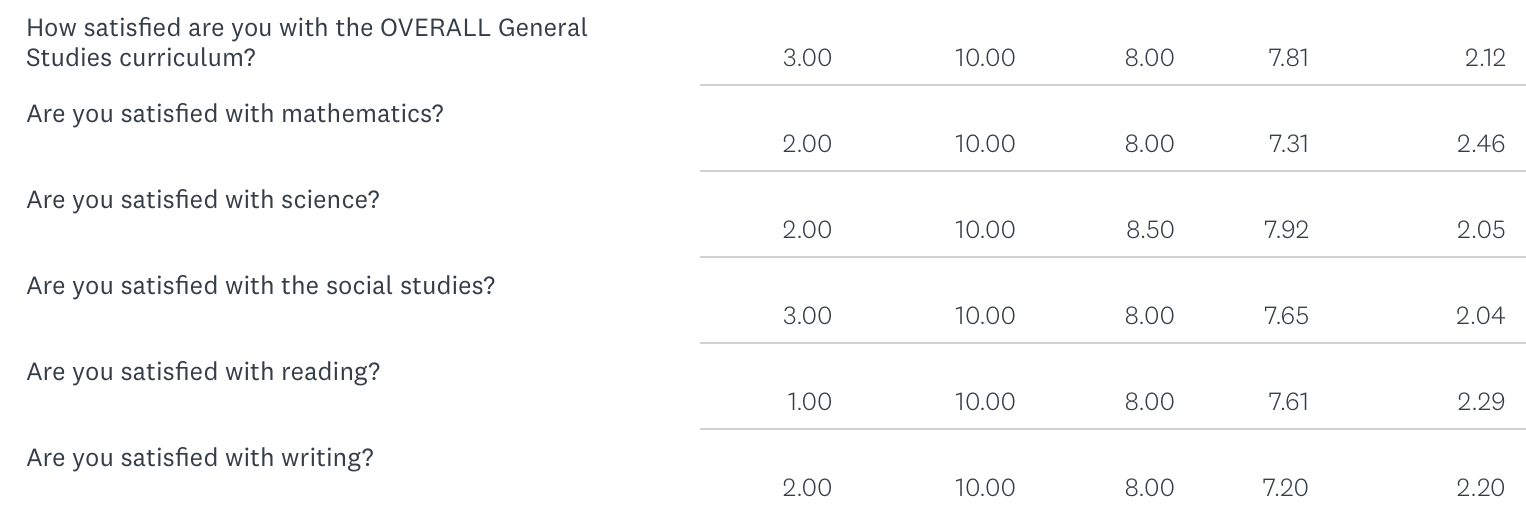
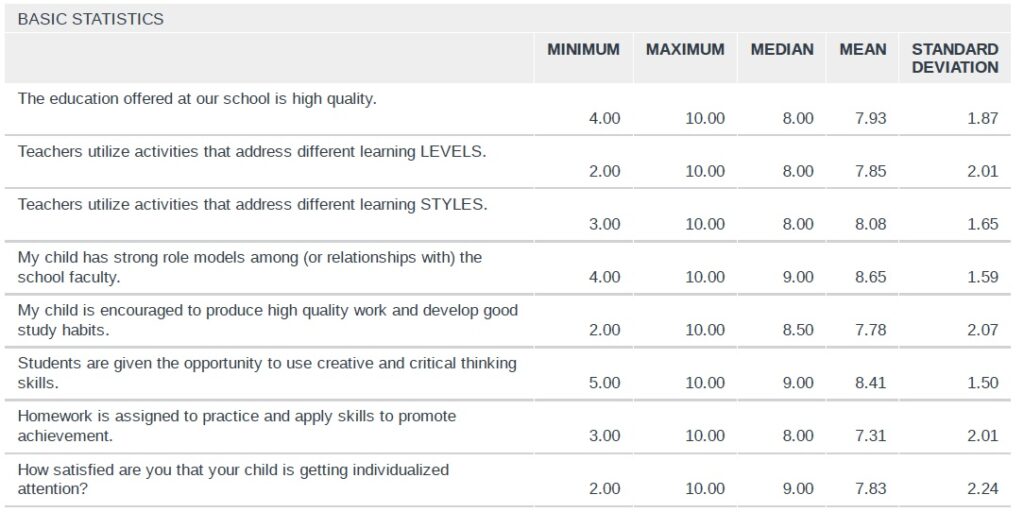
  • Now this data set is revealing.  This is the first section that does not indicate a meaningful dip.  Despite the concerns above, this same set of parents has given us very high marks for General Studies.
  • With a full year in the Makerspace, with having done meaningful PD on the “Science of Reading”, and an overall return to business as usual, it is nice to find all our scores in the acceptable range (especially in a “down year”) in the category that most parents would deem paramount.


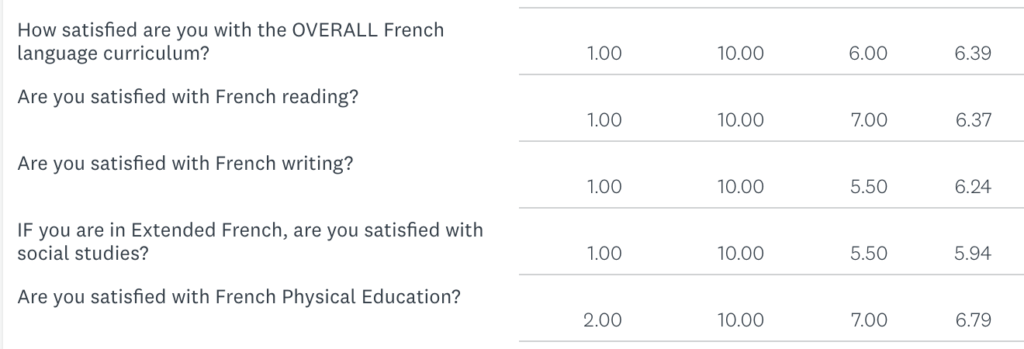
  • I would like these numbers to be higher, of course, but they are fairly in line with prior years.  One would have hoped that the added emphasis this year – the DELF, the investment in new curricular materials, etc., – would have yielded higher results, but the anonymity makes it hard to know how many students represented in this survey are in Core French, Extended French, etc.  I do know how hard our French Faculty work, so bon travail to the French Department as we continue to raise the bar each year.
  • I am very pleased with a baseline 6.79 for the first year of French PE – that rounds into the acceptable range with lots of room to grow.


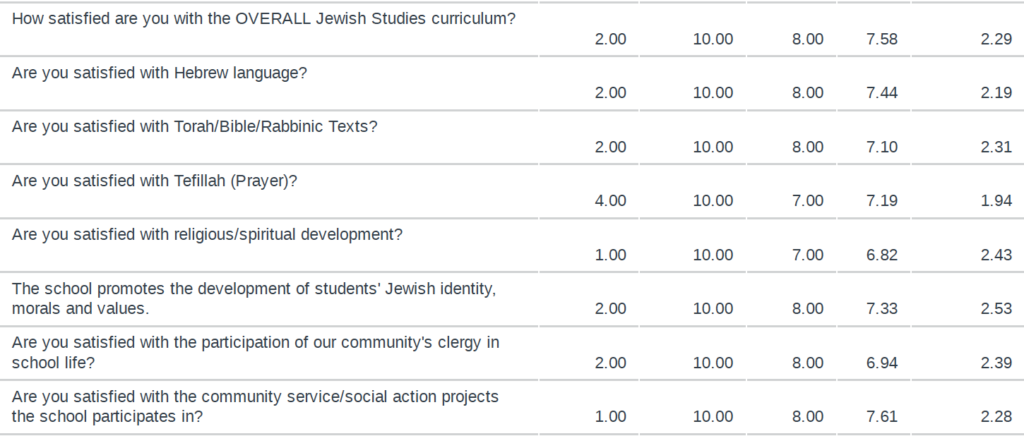
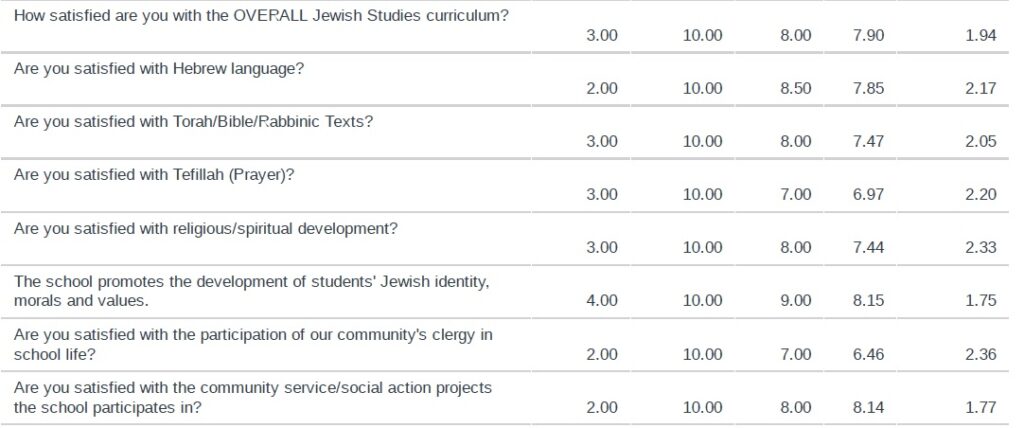
  • We are pleased to see all our Jewish Studies metrics continue to hold strong for another year.   Considering, that we have transitioned away from a “Head of Jewish Studies” model (for now), this is especially encouraging.  Kol ha’kavod to the Jewish Studies Department!
  • Last year I said that, “I am taking the slight dip in “Tefillah” as a personal challenge!  It is my favourite subject to teach (students) and to coach (teachers) and I am going to make it my mission to push prayer past 7.0.”  Mission accomplished!
  • Last year, I said that, “I am also going to – assuming a return to normal – encourage our community’s rabbis to resume a greater role in Jewish life at OJCS.”  Well, it went up…but we could and will do more.


  • Great job Mr. Ebbs for keeping our Art Program moving in the right direction!
  • Coming out of COVID, it is nice to see that both Extracurricular and Athletics have ticked up a notch!
  • Hot Lunch and After School Programming have ticked down a bit – these are areas where we work with partners and we’ll be carrying these results to them in order to see where we can improve for next year.

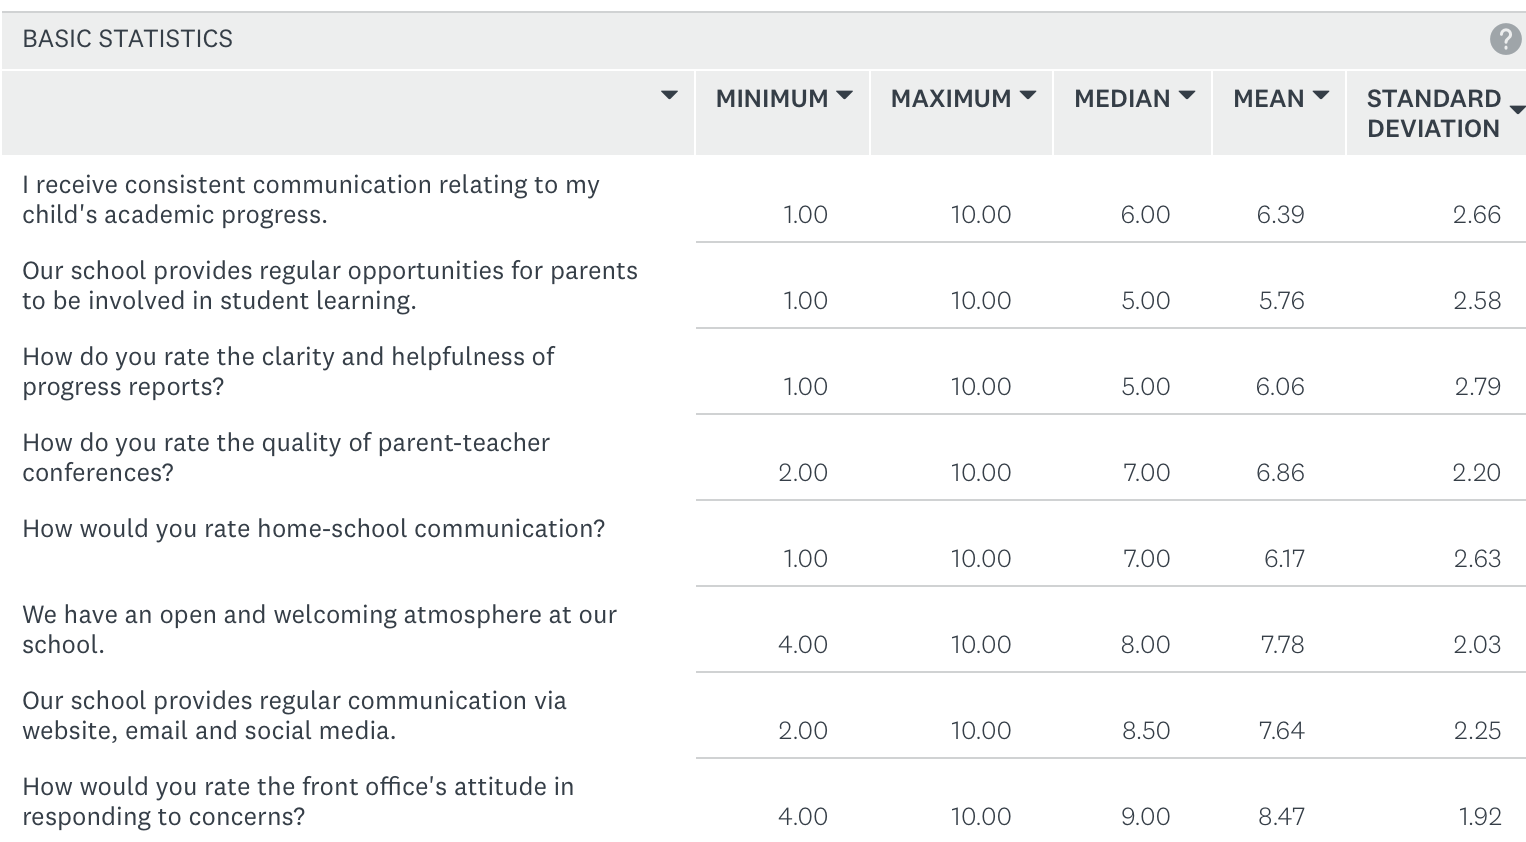
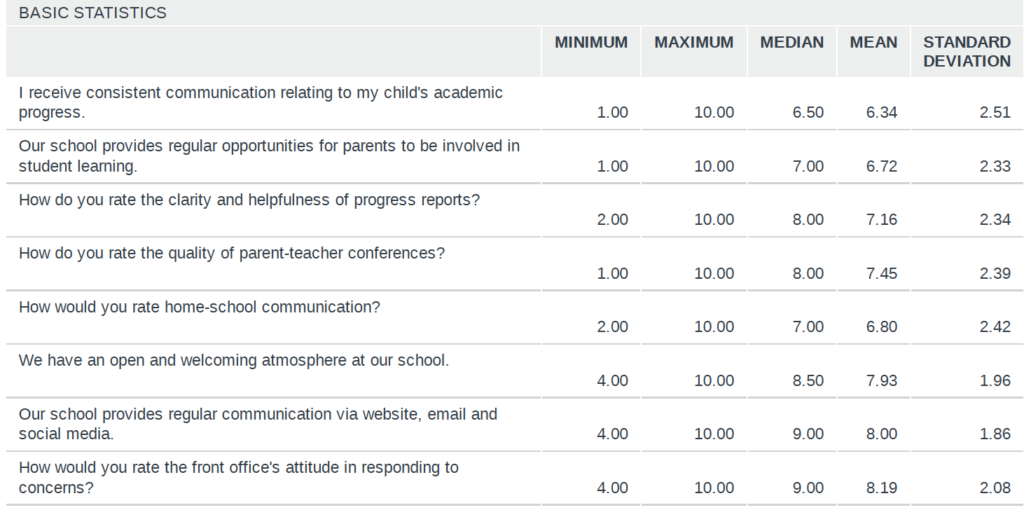
  • These are mostly wonderful scores, all just about the same and well into the healthy ranges.  We know that we have our teachers and Ellie to thank for a lot of those high scores!
  • We will be making meaningful changes next year to our academic calendar – which will include when and how we schedule Parent-Teacher Conferences.  We are excited to share this with you soon and think that will have a positive impact on how parents receive feedback on their child(ren)’s academic progress.  Stay tuned!

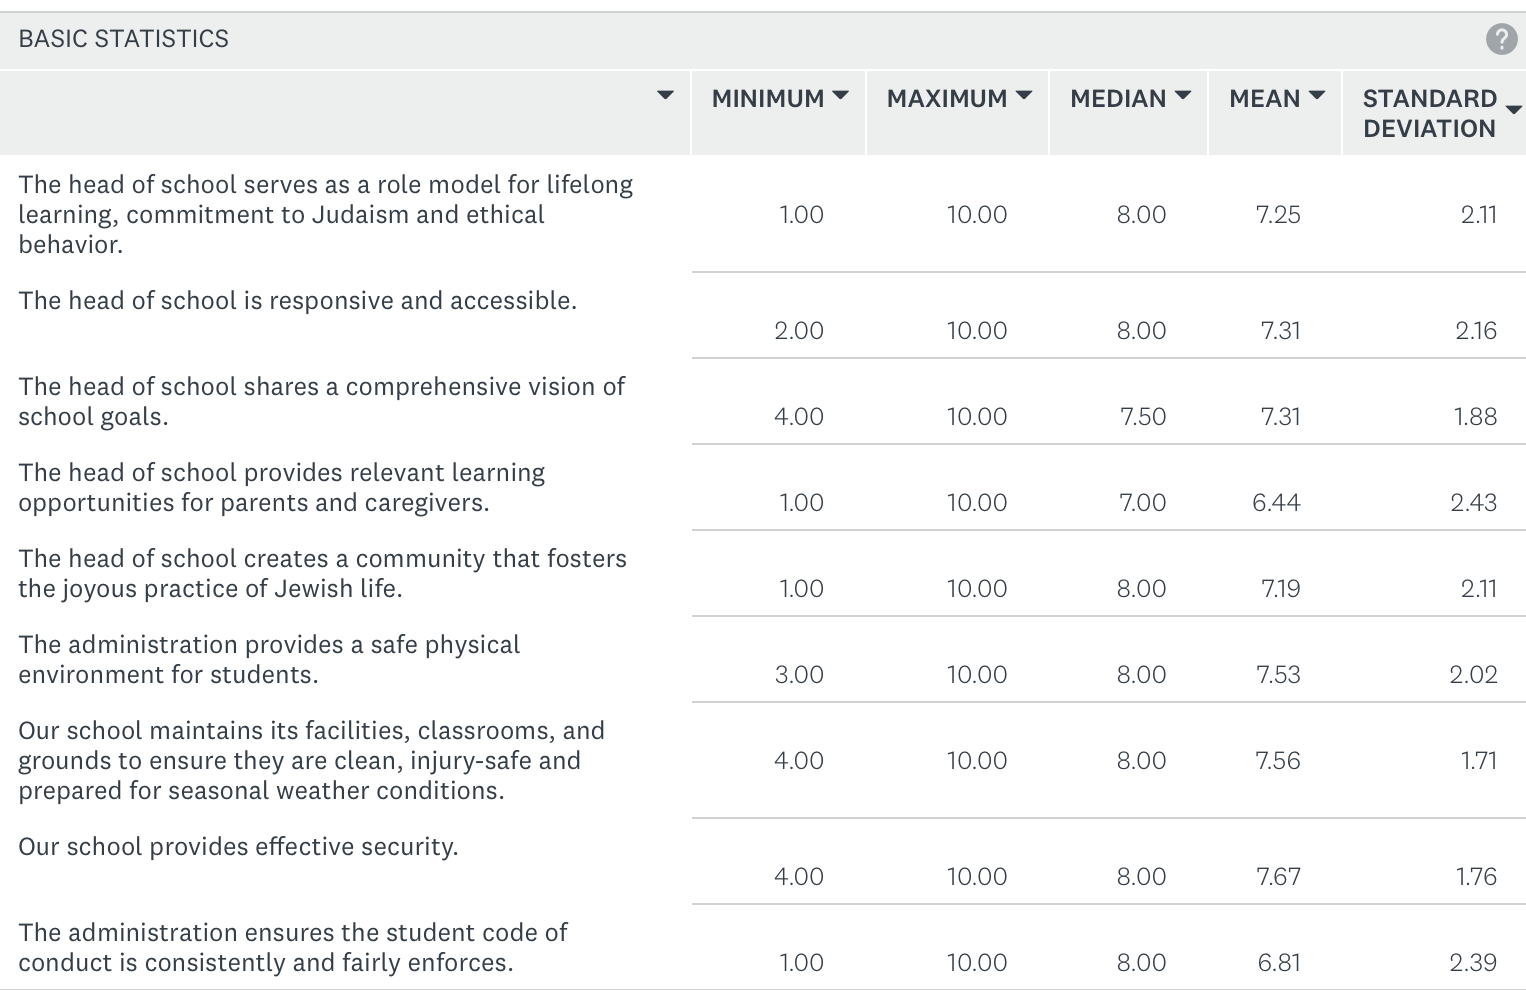
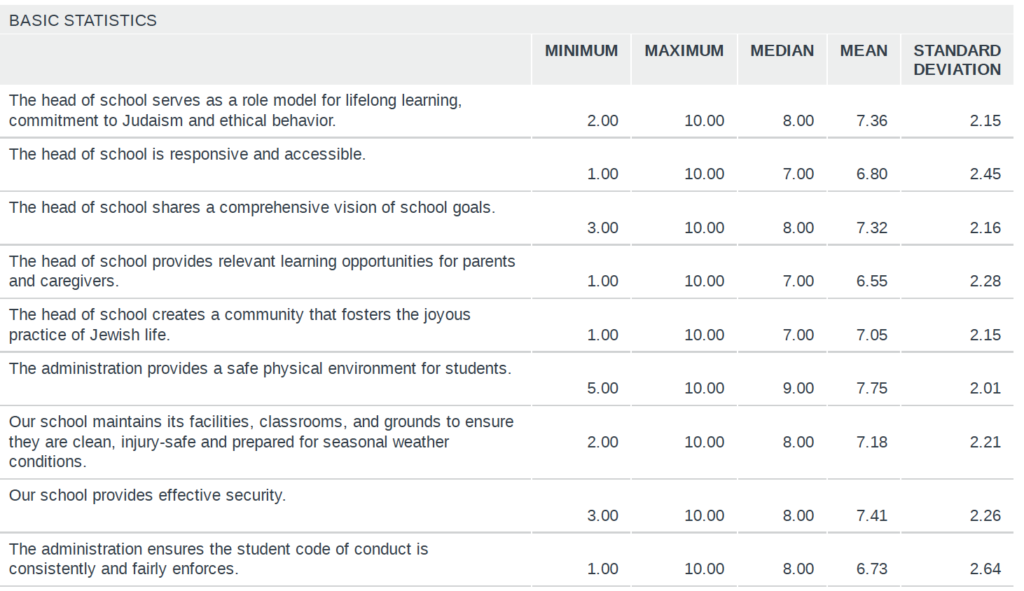
  • I have already shared my thoughts on my own job performance in my prior “Transparency Files” post.  I will simply state here my numbers, like all the above are largely the same, with the same across-the-board dip.  The one data point that I will be reflecting on is my “responsive/accessibility” – I’d like to see this trend upwards in the year to come.
  • The one metric that I am disappointed to see take a dip down after three straight positive years is the last one, which essentially serves as a proxy for school-wide behavior management.  Four years ago we scored a 6.69 and I stated that, “we are working on launching a new, school-wide behavior management system next year based on the “7 Habits” and anchored in our “North Stars”.  I will be surprised if this score doesn’t go up next year.”  Well, three years ago it came in at 7.65, two years it climbed up to 8.19, and it remained high at 7.85 last year.  6.73 puts at back at square one – even if it rounds into the acceptable range, and even with a small sample size.  Parents at OJCS can expect to see significant attention being paid to overall behavior management in 2023-2024.

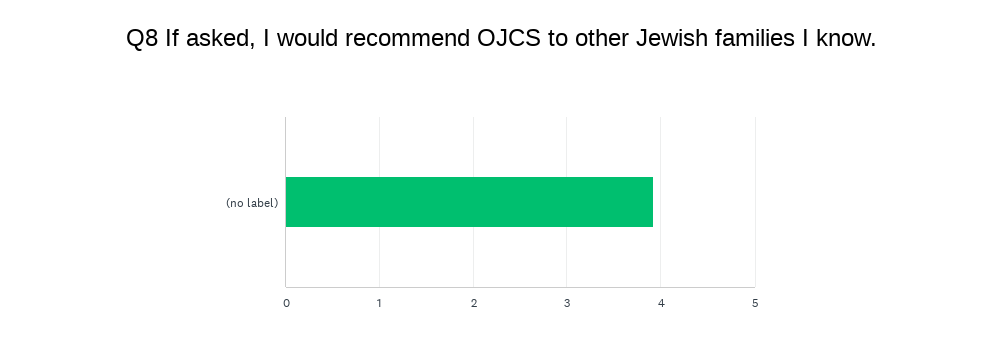
Last data point [Remember this question was scaled 1-5.]:

Our score remains consistent from 4.44 to 4.34 to 4.34 to 4.14.  Considering the overall results, this is a fairly positive data point, even if the trend line is not what we would prefer.

So there you have it for 2022-2023!

Thanks to all the parents who took the time and care to fill out surveys!  In addition to the multiple choice questions, there were opportunities for open-ended responses and a couple of experimental sections.  Your written responses added an additional layer of depth; one which is difficult to summarize for a post like this.  Please know that all comments will be shared with those they concern.  (This includes a full set of unedited and unredacted results which goes to the Head Support and Evaluation Committee of our Board of Trustees.)

As I said at the beginning, without meaningful data we don’t know how high to put the “floor” we stand upon to reach towards our North Stars.  We will likely look to change our feedback loop to ensure we hear more from more families.  That way, we can make sure that without a ceiling, we aim to reach higher each year…

The Transparency Files: Annual Parent Survey

Looking out my office window at the sunny skies [when I first wrote this on Tuesday afternoon!], is both a reminder of the first stirrings of normalcy and what we hope next year and beyond will bring… as atypical as this third year of COVID has been, we do find comfort in familiar habits and experiences.  And so if it is May, it must be time to share the results of this year’s Annual Parent Survey.  If you would like to see a full comparison with last year, you can reread those results or have them open so you can toggle back and forth.  In this post, I will try to capture the highlights and identify what trends seem worth paying attention to.

The first thing to name, which does not come as a tremendous surprise considering the times we are living through, is that we continue to have a less-than representation.   In fact, it seems that the more we grow, the percentage of students represented by the survey decreases.  Our enrollment has grown each year that I have been here, but our survey has gone from covering 81 students to 84 students to 54 students to 58 students to 52 students.  That means that this year’s survey represents barely more than a quarter of our student population!  As the survey is per student, not per family, it runs the risk of being even less representative than that.  (In the service of anonymity, we have no way of knowing how many families the survey actually represents.)  Our goal of 50% seems more and more unrealistic each year.  [If you have feedback on what might incentivize greater participation, please drop it in the comments or email it to us directly.]

I simply no longer know if or how to draw meaningful conclusions about participation rates.  Whereas it is common wisdom that folks with concerns are usually more likely to fill out these surveys, there is no common wisdom when it comes to pandemic times.  So for what we hope is one final year, instead of worrying about the motivations for why families did or didn’t fill out surveys, let’s celebrate the parents who did participate and try to make meaning of what they are telling us.

For the second consecutive year, we have more spread than normal.  It is more typical to have a big cluster in the youngest grades with diminishing returns as you get older.  Again this year, we have a healthy distribution across most of our grades.

Without knowing how representative this quarter of students is, this data for sure lines up with what is true – that we have, again, had a fast and successful re-registration.  The percentage who replied “yes” is up and the “noes” are always complicated to unpack because we have no way of knowing who of the “noes” represent graduations or relocations, as opposed to choosing to attrit prior to Grade 8).  What continues to be true is that the overwhelming majority of families – regardless of their feedback – stay with us year-after-year.  This continues to say a lot about them and a lot about us.

Let’s look at the BIG PICTURE:

The first chart gives you the weighted average satisfaction score (out of 10); the second chart gives you the breakdown by category.  I will remind you that for this and all categories, I look at the range between 7-9 as the healthy band, obviously wanting scores to be closer to 9 than to 7, and looking for scores to go up each year.  In terms of “overall satisfaction”, we have now gone from 7.13 to 7.20 to 8.17 to 7.91 to 8.0.  Although it is just a tick up from last year, the difference is statistically insignificant.  This is just the second time that no families graded the school a 1, 2 or 3.  Of course, we always want to see numbers continue to go up, but based on how we survey it is hard to get much higher.

This continues to be a good news story, but let’s dig deeper…
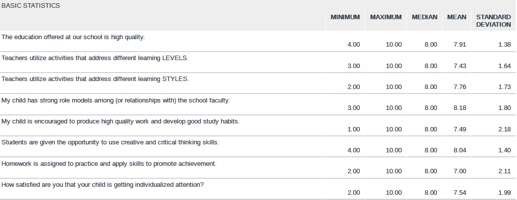
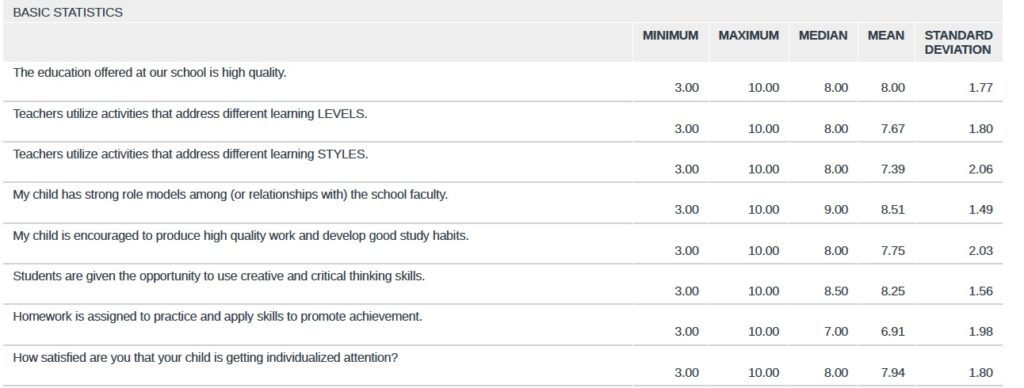
  • The topline number – probably the most important – like our overall satisfaction is slightly up 7.91 to 7.93 and a very positive outcome.
  • I am very pleased to see that every single category is up from last year’s all-time highs and that each score is well within the healthy range!
  • I am thrilled to see that relationships with faculty again comes in with the highest score (8.65) in this block, especially when you factor in all the challenges the of pandemic have created.  Kudos to our teachers!
  • Our lowest score (again) is again in “Homework” but it does continues to climb from 6.56 to 6.91 to 7.0 to 7.31.  Progress has been steady, and we are seeing steady improvement in the full implementation of our new Homework Philosophy.
  • I am thrilled to see such a high score (8.41) for “creative and critical thinking skills”…that is very much #TheOJCSWay.

  • After having seen steady growth on the topline number, which again is so critical to our school, it is a bit disappointing to see a drop.  We have gone from 6.61 to 6.97 to 7.58 to 7.15.  It remains well within the healthy range, but we will be looking to get back on the upward track next year.
  • The metrics for Spec Ed are a bit of mixed bag with the communication score holding steady, but the satisfaction score for those who have IEPs dipping just a bit.  The numbers remain strong and of all the things to suffer during the pandemic, it is not surprising to see it impact our most vulnerable students.  Kudos to Sharon Reichstein, our Director of Special Needs Education, and her new team for all their work this year!

  • Thrilled to see that our topline number continues to remain (essentially) at 8!
  • Very happy to see that every metric in General Studies is well into the healthy band and each one is essentially unchanged.
    • Math: 7.09 to 7.60 to 7.67 to 7.15.
    • Science: 7.09 to 7.72 to 7.61 to 8.37.
    • Social Studies: 7.41 to 7.96 to 7.95 to 7.86.
    • Reading: 6.93 to 8.0 to 7.85 to 8.29.
    • Writing: 6.51 to 7.07 t0 7.41 to 7.95
  • The biggest movement this year, which I am thrilled to see is “Science”, where we have invested precious bandwidth in Hackathons and Innovation Day and reopening the OJCS Makerspace, and in “Reading” where we have, not coincidentally, a number of teachers focusing on their professional growth.  This is a clear example over time where parent voice, aligned with teacher and student voice, leads to meaningful action.  (Fill out those surveys y’all!  We really do pay attention.)
  • I am also very pleased to see “Writing”, like “Reading” continuing on a strong upward trajectory over the last four years.

  • I am pleased to report that despite another year of COVID functioning and the continued integration, that the quarter of students represented in this survey are reporting steady numbers for French outcomes.
  • We would like to believe that the result of our TACLEF consultancy is continuing to pay dividends and that our recent announcement of expanding our French program to incorporate French-language physical education will help these numbers continue to tick up in the years ahead.  Bon travail to the French Department!

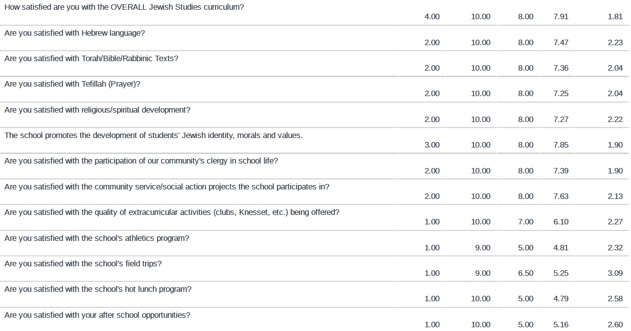
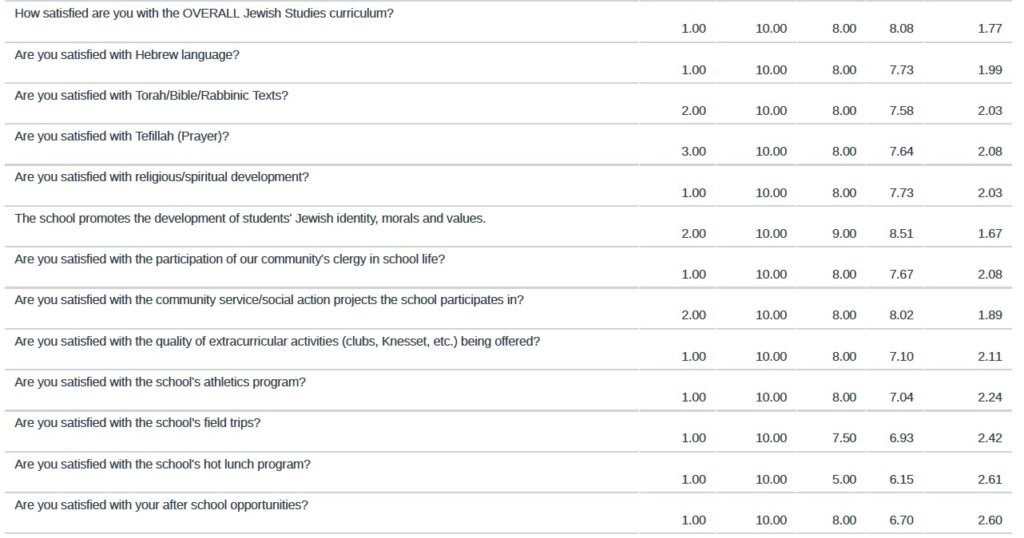
  • We are again thrilled to see all our Jewish Studies metrics continue to hold strong for another year.  We are especially pleased to see the OVERALL metric essentially hold steady from 7.29 to 8.08 to 7.91 to 7.90.  Considering, that we again went forward without filling the “Dean of Judaics” position and all the additional COVID-related challenges, this is especially encouraging.  Kol ha’kavod to the Jewish Studies Department!
  • I am taking the slight dip in “Tefillah” as a personal challenge!  It is my favourite subject to teach (students) and to coach (teachers) and I am going to make it my mission to push prayer past 7.0.
  • I am also going to – assuming a return to normal – encourage our community’s rabbis to resume a greater role in Jewish life at OJCS.

  • Considering the circumstances, it is both surprising and positive that with all the protocols that were in place that we’d see growth in both Art and PE – both of which have reentered the healthy band.  We know that even with a rigorous, trilingual curriculum, that we need to continue to offer the kinds of high-quality PE/Drama/Art experiences that make a well-rounded education.  We said last year to “look for these numbers to go back up next year”.  Mission accomplished!
  • It is worth noting that even though none of our extracurriculars, athletics, hot lunch, etc., programming has reached pre-COVID numbers (understandably) they are all up from last year…with lots of room to grow.

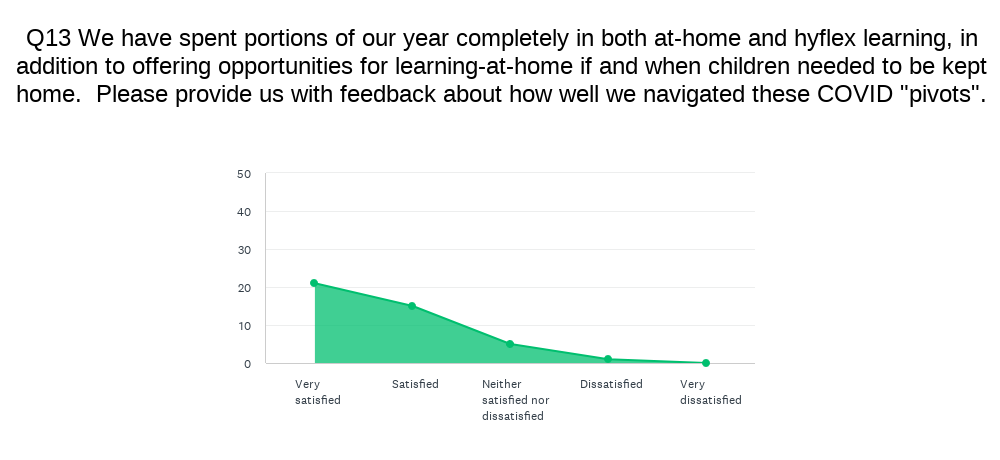
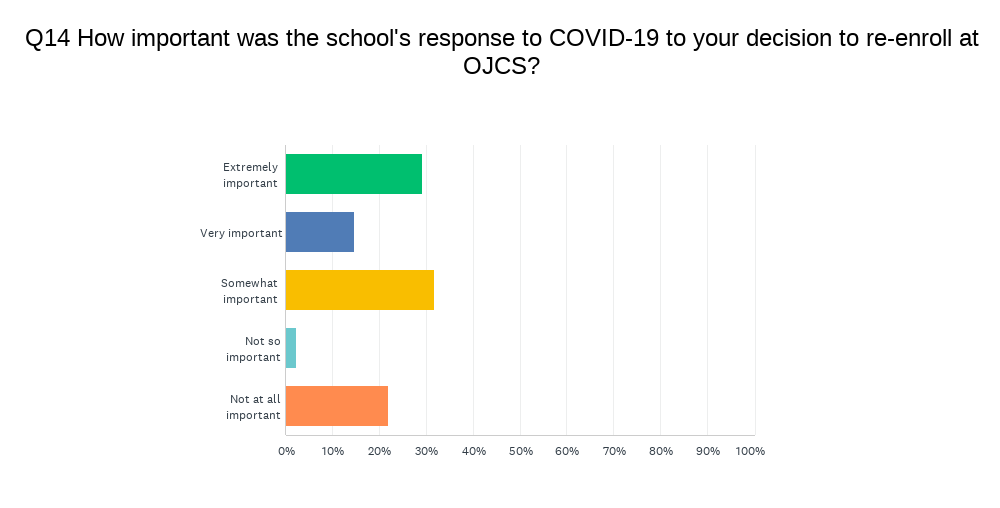
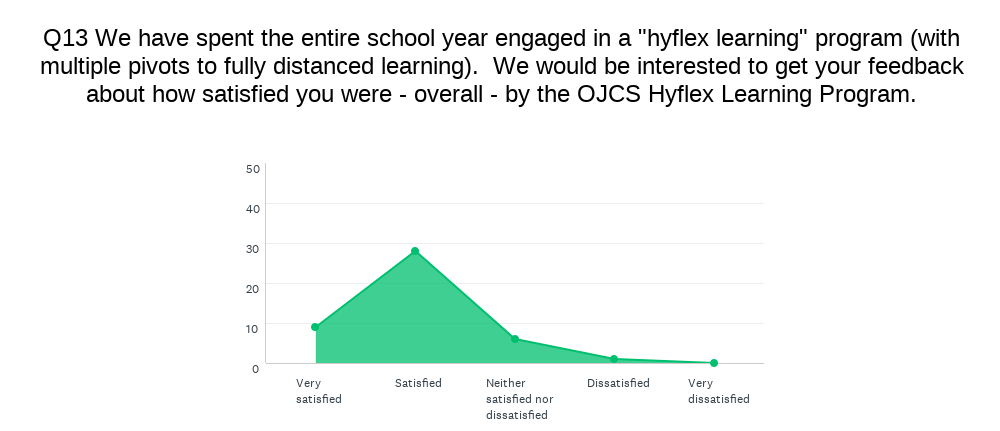
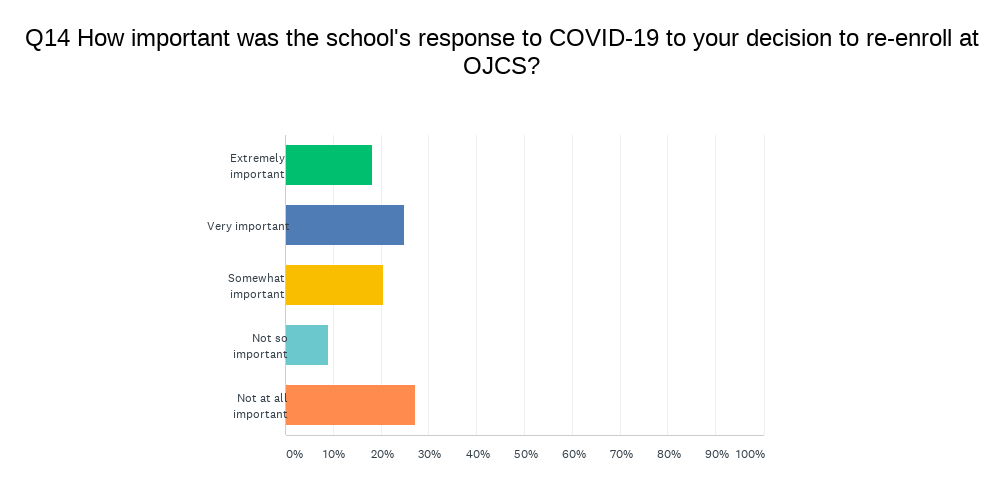
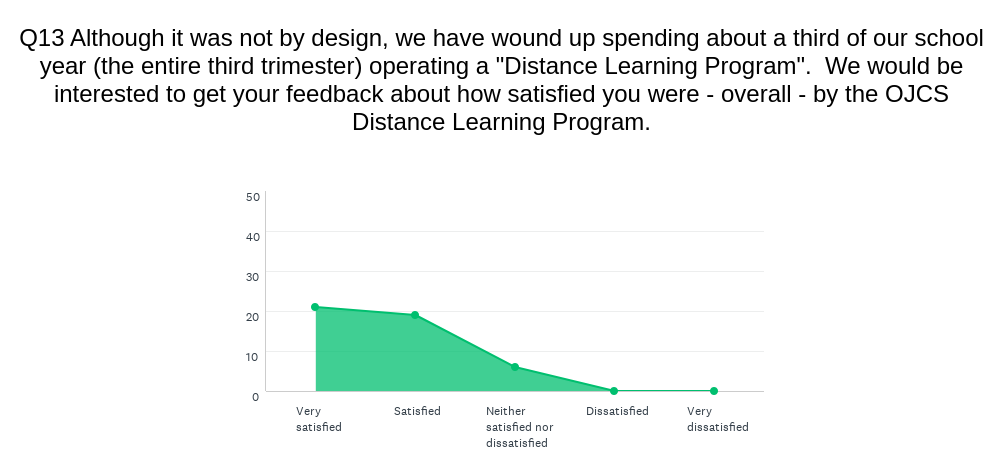
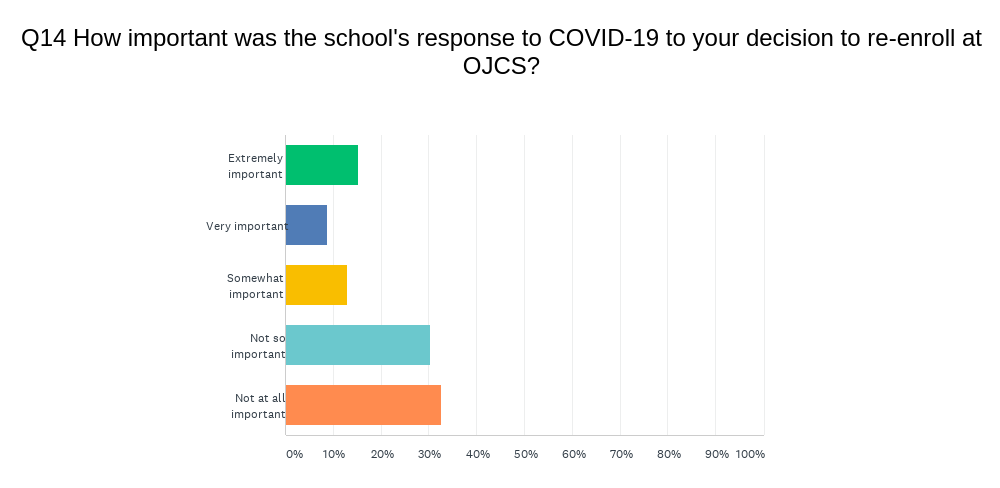
From this year’s experimental section, we yield these two data points (and two sets of meaningful commentary).  Compared to last year, there is a larger cluster in “very satisfied” and “extremely important” – which is likely not a coincidence.  As we cannot predict the future, even with wholehearted hope of a return to year-round, in-person learning next year, our ability to navigate situations like these last few years with minimal disruption and maximal academic progress – not to mention the continuance of meaningful Jewish experiences – will likely continue to be powerful value-adds for OJCS in the years ahead.

  • These are mostly wonderful scores, all just about the same and well into the healthy ranges.  We know that we have Ellie to thank for a lot of those high scores!
  • I am sadly saying again this year, that, “[a]fter having to take a COVID pause, I will be interested to see what the impact of ‘Student-Led Conferences’ will be on the ‘parent-teacher conferences’ metric once finally launched.

  • I have already shared my thoughts on my own job performance in my prior “Transparency Files” post.  I will simply state here my pleasure in seeing my numbers holding strong, with the weakest one – providing learning opportunities for parents and caregivers with some health post-COVID room to grow.
  • The one metric that I am very pleased to see holding strong is the last one, which essentially serves as a proxy for school-wide behavior management.  Three years ago we scored a 6.69 and I stated that, “we are working on launching a new, school-wide behavior management system next year based on the “7 Habits” and anchored in our “North Stars”.  I will be surprised if this score doesn’t go up next year.”  Well, two years ago it came in at 7.65, last year it climbed up to 8.19, and it remains high at 7.85 this year.

Last data point:


Remember this question was scaled 1-5.   Our score remains consistent from 4.44 to 4.34 to 4.34 (again).  I have said that I truthfully don’t know how much more there reasonably is to grow here, but we’ll keep doing our best to find out!

So there you have it for 2021-2022!

Thanks to all the parents who took the time and care to fill out surveys!  In addition to the multiple choice questions, there were opportunities for open-ended responses and a couple of experimental sections.  Your written responses added an additional layer of depth; one which is difficult to summarize for a post like this.  Please know that all comments will be shared with those they concern.  (This includes a full set of unedited and unredacted results which goes to the Head Support and Evaluation Committee of our Board of Trustees.)  As you can see, we really do use this data to make enhancements and improvements each year.

We very much wish to continue into next year, this year’s trend in maintaining and increasing positive outcomes and satisfaction.  To mix school metaphors, each year simply becomes the higher “floor” we stand upon to reach towards our North Stars.  With no ceiling, we aim to reach a little closer each time.

The Transparency Files: Annual Parent Survey

Looking out my daughter’s bedroom window – as this is where I now work from, when I work from home – at the empty sunny streets, is both a reminder of what is presently true and a foretaste of what we all hope will shortly become true, the first stirrings back towards normalcy.  As atypical as this year has been, we do find comfort in familiar habits and experiences.  And so if it is mid-May, it must be time to share the results of this year’s Annual Parent Survey.  If you would like to see a full comparison with last year, you can reread those results or have them open so you can toggle back and forth.  In this post, I will try to capture the highlights and identify what trends seem worth paying attention to.

The first thing to name, which does not come as a tremendous surprise considering the times we are living through, is that we continue to have a less-than representation.  The only good news here is that we have at least stabilized a bit.  We have gone from 81 students to 84 students to 54 students to 58 students.  With increased enrollment, it essentially holds steady from last year, with the survey representing no more than a third of our student population.  As the survey is per student, not per family, it runs the risk of being even less representative than that.  (In the service of anonymity, we have no way of knowing how many families the survey actually represents.)  We had set a goal of 50% and we have a long way to go.  If you have feedback on what might incentivize greater participation, please drop it in the comments or email it to us directly.

Of course, this is definitely not an “all things being equal” circumstance.  This is definitely not a year for drawing any meaningful conclusions about participation rates.  Whereas it is common wisdom that folks with concerns are usually more likely to fill out these surveys, there is no common wisdom when it comes to pandemic times.  So for what we hope is just one more year, instead of worrying about the motivations for why families did or didn’t fill out surveys, let’s celebrate the parents who did participate and try to make meaning of what they are telling us.

Interestingly, we have more spread than normal.  It is more typical to have a big cluster in the youngest grades with diminishing returns as you get older.  This year, we have a healthy distribution across most of our grades.
Without knowing how representative this third of students are, this data for sure lines up with what is true – that we have had the fastest and most successful re-registration in recent history!  The percentage who replied “yes” is up and the “nos” are always complicated to unpack because we have no way of knowing who of the “no’s” represent graduations or relocations, as opposed to choosing to attrit prior to Grade 8).  What continues to be true is that the overwhelming majority of families – regardless of their feedback – stay with us year after year.  This continues to say a lot about them and a lot about us.

Let’s look at the BIG PICTURE:

The first chart gives you the weighted average satisfaction score (out of 10); the second chart gives you the breakdown by category.  I will remind you that for this and all categories, I look at the range between 7-9 as the healthy band, obviously wanting scores to be closer to 9 than to 7, and looking for scores to go up each year.  In terms of “overall satisfaction”, we have now gone from 7.13 to 7.20 to 8.17 to 7.91.  Although it is just a tick down from last year, the difference is statistically insignificant.  Interestingly, this is the first time that no families graded the school a 1, 2 or 3.  Of course, we always want to see numbers go up, and not down, but based on how we survey it is hard to get much higher.

This continues to be a good news story, but let’s dig deeper…

[Please note that if it is little blurry, it is how I have to cut-and-paste-and-scan the data.  Hopefully, you can zoom in a bit more if you need.]

  • The topline number – probably the most important – like our overall satisfaction is barely down from 8.0 to 7.91 and a very positive outcome.
  • I am very pleased to see that every single category is essentially unchanged from last year’s all-time highs and that for the first time each score is in the healthy range!
  • I am thrilled to see that relationships with faculty comes in with the highest score (8.18) in this block, especially when you factor in all the challenges this year of pandemic have created.  Kudos to our teachers!
  • Our lowest score (again) is again in “Homework” but it continues to climb from 6.56 to 6.91 to 7.0, putting it inside the healthy band for the first time.  Progress has been slow, but we are seeing steady improvement in the full implementation of our new Homework Philosophy.

  • We have seen steady growth on the topline number, which again is so critical to our school from 6.61 to 6.97 to – finally! – jumping up to 7.58!  I wonder if having a higher percentage of families with older children and/or a percentage of families joining OJCS from other schools moves the needle?  It could verify that parents’ perceptions of their child(ren) as being well prepared for high school grows higher as they get closer (which would be good) to graduation.
  • The metrics for Spec Ed are a bit of mixed bag with the communication score dipping down a bit, but the satisfaction score for those who have IEPs jumping up meaningfully.  The numbers remain strong and of all the things to suffer during the pandemic, it is not surprising to see it impact our most vulnerable students.  Kudos to Sharon Reichstein, our Director of Special Needs Education, and her team for all their work this year!

  • Thrilled to see that our topline number continues to remain over 8!
  • Very happy to see that every metric in General Studies is well into the healthy band and each one is essentially unchanged.
    • Math: 7.09 to 7.60 to 7.67.
    • Science: 7.09 to 7.72 to 7.61.
    • Social Studies: 7.41 to 7.96 to 7.95.
    • Reading: 6.93 to 8.0 to 7.85.
    • Writing: 6.51 to 7.07 t0 7.41.
  • The biggest movement, which I am very pleased to see, is in “Writing” where we have, not coincidentally, a number of teachers spending what bandwidth for professional growth they have available on increasing rigor in our writing program.  This is a clear example over time where parent voice, aligned with teacher and student voice, leads to meaningful action.  (Fill out those surveys y’all!  We really do pay attention.)

  • I am so pleased to report that (if you allow for just a hint of rounding) not only are all our metrics up, but French at OJCS has finally fully entered the healthy band!  That’s fantastic news!  Our OVERALL metric went from 5.66 to 6.54 to 6.85.  French reading grew from 5.58 to 6.36 to 7.07.  French writing went 5.35 to 6.07 to 6.95.  To what can we attribute this growth?  Two things leap out: 1) The addition of three new, high-quality French Teachers and, 2) The impact of our final year of consultancy with TACLEF.  When you factor in how hard it has been to integrate the work of the consultancy to hyflex and distance learning, it makes the achievement all the more significant.  There is still room to grow, of course, but four years in, perhaps we can finally say that the narrative around French outcomes at OJCS has finally shifted.  Bon travail to the French Department!
  • Sticking with the theme of this section, it is not surprising with all the protocols that were in place that we’d see dips in both Art and PE.  We’ve made it hard for those teachers to deliver their usual excellence and in that context, their scores can be interpreted to be quite positive.  We know that even with a rigorous, trilingual curriculum, that we need to continue to offer the kinds of high-quality PE/Music/Art experiences that make a well-rounded education.  Look for these numbers to go back up next year.

  • We are again thrilled to see all our Jewish Studies metrics continue to hold strong for another year.  We are especially pleased to see the OVERALL metric essentially hold steady from 7.29 to 8.08 to 7.91.  Considering, that we went forward without filling the “Dean of Judaics” position and all the additional COVID-related challenges, this is especially encouraging.  Kol ha’kavod to the Jewish Studies Department!
  • We have tried really hard not to let COVID be the excuse throughout the course of the year, but when it comes to the rest of the categories in this chart, it is hard not to.  These scores are way lower than normal, but unless they stay there again next year, I am inclined to view them a COVID blip.
  • Similarly with “Hot Lunch,” between COVID and the change in status for Creative Kosher, one expects us to be better prepared next year and I’ll look for this score to return to normalcy.

From this year’s experimental section, we yield these two data points (and two sets of meaningful commentary).  As we cannot predict the future, even with wholehearted hope of a return to year-round, in-person learning next year, our ability to navigate situations like this with minimal disruption and maximal academic progress – not to mention the continuance of meaningful Jewish experiences – will likely continue to be powerful value-adds for OJCS in the years ahead.
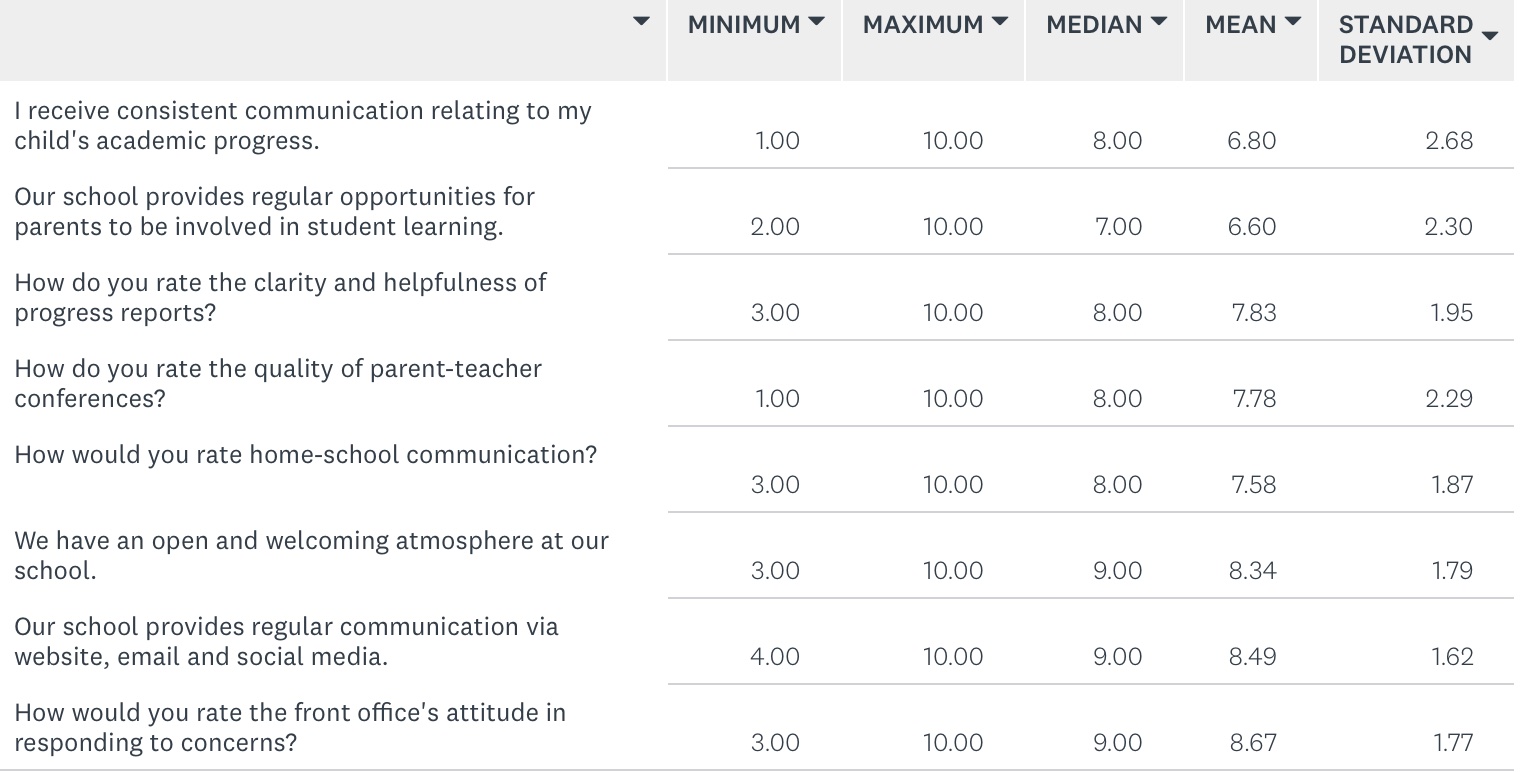
  • These are wonderful scores, all a bit higher than last year and all well into the healthy band!  We know that we have Ellie to thank for a lot of those high scores!
  • After having to take a COVID pause, I will be interested to see what the impact of “Student-Led Conferences” will be on the “parent-teacher conferences” metric once finally launched.

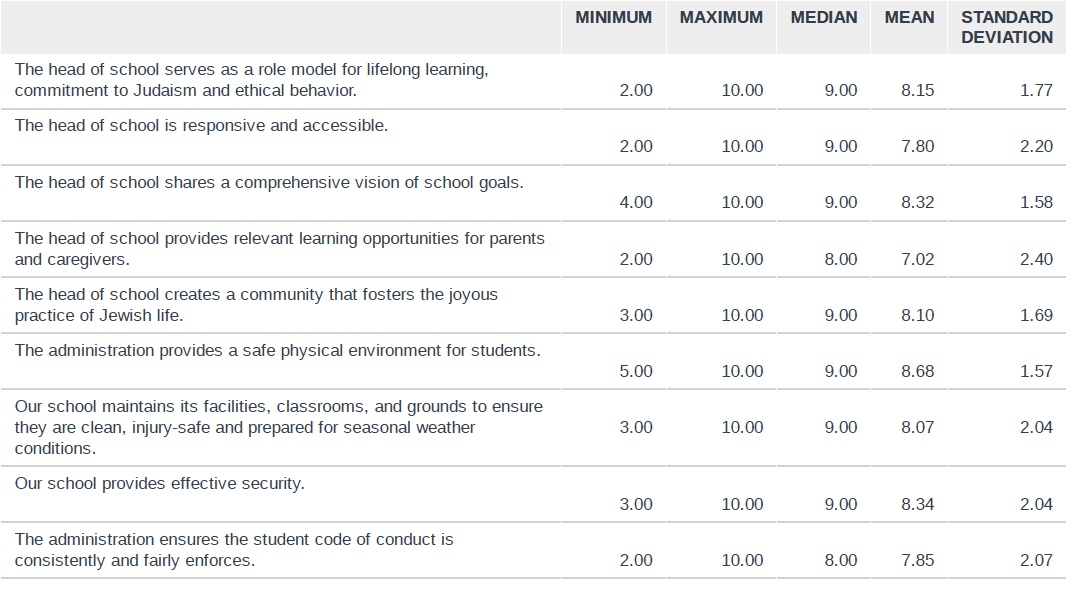
  • I have already shared my thoughts on my own job performance in my prior “Transparency Files” post.  I will simply state here my pleasure in seeing all these numbers climb from the prior year.
  • It is especially heartwarming to see the highest score we have ever registered, 8.89 (!), for providing a safe environment.  That, more than anything, is the story of the year.
  • The one metric that I am very pleased to see continue to climb is the last one, which essentially serves as a proxy for school-wide behavior management.  Two years we scored a 6.69 and I stated that, “we are working on launching a new, school-wide behavior management system next year based on the “7 Habits” and anchored in our “North Stars”.  I will be surprised if this score doesn’t go up next year.”  Well, last year it came in at 7.65 and this year it climbed up to 8.19.

Last data point:

Remember this question was scaled 1-5.   Our score remains consistent from 4.44 to 4.34.  I said last year, that I truthfully don’t know how much more there reasonably is to grow this, but we’ll keep doing our best to find out!

So there you have it for 2020-2021!

Thanks to all the parents who took the time and care to fill out surveys!  In addition to the multiple choice questions, there were opportunities for open-ended responses and a couple of experimental sections.  Your written responses added an additional layer of depth; one which is difficult to summarize for a post like this.  Please know that all comments will be shared with those they concern.  (This includes a full set of unedited and unredacted results which goes to the Head Support and Evaluation Committee of our Board of Trustees.)  As you can see, we really do use this data to make enhancements and improvements each year.

We very much wish to continue into next year, this year’s trend in increasing positive outcomes and satisfaction.  To mix school metaphors, each year simply becomes the higher “floor” we stand upon to reach towards our North Stars.  With no ceiling, we aim to reach a little closer each time.

The Transparency Files: Annual Parent Survey

I took advantage of the holiday weekend (Victoria Day, my American friends) with little opportunity to do much other than enjoy the weather at great (social) distance, to go through the results of this year’s Annual Parent Survey.  If you would like to see a full comparison with last year, you can reread those results or have them open so you can toggle back and forth.  In this post, I will try to capture the highlights and identify what trends as seem worth paying attention to.

The first thing to name, which does not come as a tremendous surprise considering the times we are living through, is that both the number and percentage of students captured in this year’s survey is markedly down from the prior two years.  We have gone from 81 students to 84 students to 54 students.  This represents about 32% of our student population.  (Even less where not each survey is fully filled out.)  As the survey is per student, not per family, it runs the risk of being even less representative than that.  (In the service of anonymity, we have no way to actually know how many families the survey actually represents.)  Last year, we were at about 40% of students represented with a goal this year of hitting 50%.

Of course, this is definitely not an “all things being equal” circumstance.  We are still navigating distance learning and it is doubtful that drawing any meaningful conclusions about participation rates is worthwhile.  [We saw a similar decline in percentage in this year’s Annual Faculty Survey and it aligns with fieldwide data.]  Whereas it is common wisdom that folks with concerns are usually more likely to fill out these surveys, there is no common wisdom when it comes to pandemic times.  So instead of worrying this year about the motivations for why families did or didn’t fill out surveys, let’s celebrate the parents who did participate and try to make meaning of what they are telling us.

As was the case last year – and is usually the case everywhere – it is the parents of our youngest students who are the most invested with decreasing participation as the years go on.  This year, we see less Kindergarten than normal, for what that’s worth.

The percentage who replied “yes” is largely unchanged from last year (and always compounded by not knowing who of the “no’s” represent graduations or relocations, as opposed to choosing to attrit prior to Grade 8).  What is different this year is that the percentage of “undecideds” is larger than the “no’s” for the first time.  An increase of uncertainty certainly seems reasonable during a time of pandemic, although we have no way to tell the difference between correlation and causation.  What continues to be true is that the overwhelming majority of families – regardless of their feedback – stay with us year after year.  This continues to say a lot about them and a lot about us.

Let’s look at the BIG PICTURE:

The first chart gives you the weighted average satisfaction score (out of 10); the second chart gives you the breakdown by category.  I will remind you that for this and all categories, I look at the range between 7-9 as the healthy band, obviously wanting scores to be closer to 9 than to 7, and looking for scores to go up each year.  In terms of “overall satisfaction”, we have now gone from 7.13 to 7.20 to 8.17.  This year marks a meaningful jump in the right direction and you can see by the second chart that it is explained by the extremely high percentage of families who graded the school an 8, 9 or 10 and the extremely low percentage of families who graded the school a 1, 2 or 3 (in fact no families graded the school a “1” or “2”) – both of those things were not (as) true last year.  This is surely good news, but let’s dig deeper…

A few things jump out…

  • The topline number is up, fairly significantly, from 7.11 to 8.0.  This marks the first time we have reached that threshold.
  • Both learning “LEVELS” and learning “STYLES” have also crossed the threshold from the less healthy high 6’s into the mid 7’s.  It would be nice to know how much of this is attributed to improvement in general and how much to how the school has responded to distance learning, but we will have that same question to answer with almost all the data.
  • I am very pleased to see that every single category is up from the prior year and that all, but one, in this section are now firmly in the healthy 7-9 range.
  • I am thrilled to see such a high score (8.25) for “creative and critical thinking skills”.
  • Our lowest score (again) is again in “Homework” although it has climbed from 6.56 to 6.91, putting it just outside the healthy band.  As I wrote about in my self-evaluation, it is hard to know if the full implementation of our new Homework Philosophy was hindered by COVID-19, but we will look to see if this score goes up with another year of implementation under our belts.

  • Hereto, every metric is higher than last year and we still want to see each one climb a little higher.
  • The topline number has moved from 6.61 to 6.97, which is so close to being a 7, but for such an important metric, I would really like to see it closer to 8.  It would be interesting to peg this question to the grade of the student captured in the data (which I cannot do in order to protect anonymity) to see if parents’ perceptions of their child(ren) as being well prepared for high school grows higher as they get closer (which would be good) to graduation.
  • So thrilled to see all three of our metrics that deal with resource and IEPs to have grown and to all enter the healthy band!  Kudos to Sharon Reichstein, our Director of Special Needs Education, and her team for all their work this year – work that I believe has proven even more valuable during this time of distance learning.  This is a clear example over time where parent voice, aligned with teacher and student voice, leads to meaningful action.  (Fill out those surveys y’all!  We really do pay attention.)

  • Thrilled to see that our topline number has moved from 7.24 to 8.17!
  • Very happy to see that every metric in General Studies is well into the healthy band and each one is up from the prior year:
    • Math: 7.09 to 7.60
    • Science: 7.09 to 7.72
    • Social Studies: 7.41 to 7.96
    • Reading: 6.93 to 8.0
    • Writing: 6.51 to 7.07
  • I would happily attribute the meaningful increase in reading to all the work our Language Arts Teachers have done with STAR Reading / Accelerated Reader, incentivizing reading in general with the “Annual Reading Challenge” and the Scholastic Book Fair, and better integrating our Library with the Classrooms.

  • I am of two minds when it comes to our French metrics.  The positive is that all three metrics are HIGHER than they were last year at this time.  That’s good news!  Our OVERALL metric went from 5.66 to 6.54.  French reading grew from 5.58 to 6.36.  French writing went 5.35 to 6.07.  Those are all meaningful jumps in the right direction.  The negative, of course, is that they all still fall below the healthy band.  However, another year of growth like this one would put all those categories firmly there.  That should be great cause for optimism since this year’s growth can fairly be attributed to the first year of our consultancy with TACLEF – a year that got truncated by a third due to COVID-19.  Immediately before we pivoted to distance learning, we posted an update on the progress we had made this year due to TACLEF.  Knowing that we have another full year of consultancy ahead of us, should inspire greater confidence that our French outcomes will soon be on par with the rest of General Studies.  That will be quite an accomplishment considering the narrative around French outcomes that the school has been working to flip during the last three years.  Bon travail to the French Department!
  • Sticking with the theme of this section, all three of our specialty classes are up as well!  Congrats to the PE Teachers for leading PE from 6.84 to 7.75, to Morah Shira for lifting Art from 7.20 to 8.33, and to new Music Teacher, Mr. Goddard, for guiding Music from 6.80 to 7.56.  It is good to know that even with a rigorous, trilingual curriculum, that we continue to offer the kinds of high-quality PE/Music/Art experiences that make a well-rounded education.

  • We are again thrilled to see all our Jewish Studies metrics continue to climb higher after another year.  We are especially pleased to see the OVERALL metric move from 7.29 to 8.08.  With another year’s commitment to immersive Hebrew pedagogy, another year of meaningful prayer experiences, the leadership of Dr. Avi Marcovitz as our new Dean of Judaics, greater engagement of our community’s clergy, etc., we are clearly headed in the right direction.  Kol ha’kavod to the Jewish Studies Department!
  • We are pleased to see our extracurricular activities and athletics climb into the healthy range this year!  We are pleased to see field trips go up, with the hope to see it over 7 in the year to come.
  • Although our hot lunch program and our after school metrics trail behind the others, they are both UP significantly from the last year.  We will continue to work with our partners and vendors and look forward to continued growth in the year ahead.

From our experimental section, we yield these two data points (and two sets of meaningful commentary).  As we see it as almost an inevitably that schools will be required to pivot back and forth from school in a bricks-and-mortar building to school through distance learning, our ability to navigate that pivot with minimal disruption and maximal academic progress – not to mention with the continuance of meaningful Jewish experiences – will be powerful value-adds for OJCS in the years ahead.

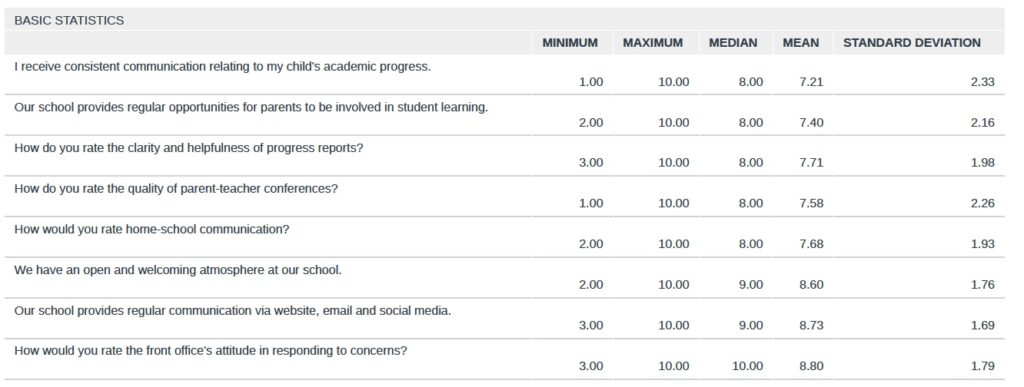
  • I noticed that I did NOT include this section (Communications) in last year’s analysis (even though I am pretty sure the questions were asked), so we will let this year’s data serve as a baseline from which to judge future metrics.
  • All of these scores are high into the healthy range!  I like to see our “open and welcoming atmosphere” come in at 8.60, our regular communication at 8.73 and the front office’s responsiveness to concerns at an 8.80 – all of our highest scores.  I think we all know that we have Ellie to thank for a lot of those high scores!
  • I will be interested to see what the impact of “Student-Led Conferences” will be on the “parent-teacher conferences” metric once launched.

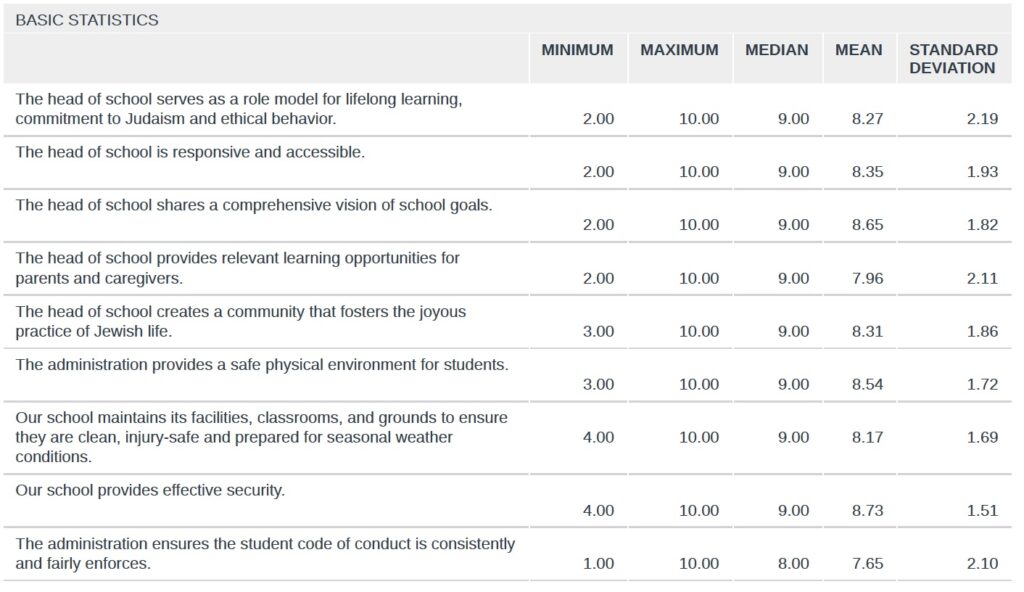
  • I have already shared my thoughts on my own job performance in my prior “Transparency Files” post.  I will simply state here my pleasure in seeing all these numbers climb from the prior year.
  • The one metric that I am very pleased to see climb is the last one, which essentially serves as a proxy for school-wide behavior management.  Last year we scored a 6.69 and I stated that, “we are working on launching a new, school-wide behavior management system next year based on the “7 Habits” and anchored in our “North Stars”.  I will be surprised if this score doesn’t go up next year.”  Well, it came in this year at a 7.65.

Last data point:

Remember this question was scaled 1-5.  Our school has climbed from last year’s 4.14 to this year’s. 4.44.  I truthfully don’t know how much more there reasonably is to grow this, but we’ll keep doing our best to find out!

So there you have it for 2019-2020!

Thanks to all the parents who took the time and care to fill out surveys!  In addition to the multiple choice questions, there were opportunities for open-ended responses and a couple of experimental sections.  Your written responses added an additional layer of depth; one which is difficult to summarize for a post like this.  Please know that all comments will be shared with those they concern.  (This includes a full set of unedited and unredacted results which goes to the Head Support and Evaluation Committee of our Board of Trustees.)  As you can see each year, we really do use this data to make enhancements and improvements each year.

We want to reverse this year’s trend in terms of parent participation, but very much wish to continue this year’s trend in increasing positive outcomes and satisfaction.  To mix school metaphors, each year simply becomes the higher “floor” we stand upon to reach towards our North Stars.  With no ceiling, we aim to reach a little closer each time.

Meaningful Parent Partnership Ought Not Be Taken For Granted

This is the first week of my parenting life where I fully understand what it means to be a regular parent.  And I love it.  And I hate it.

As we all went back to school on Tuesday, my oldest daughter, Eliana, went off to high school.  As significant a transition as it is for her, it is actually quite the transition for me.  This is the first time in my parenting life that I have a child attending a school that I do not run (or recently ran).  I don’t know the teachers.  I don’t know the administration.  I don’t fully know (or understand) the curriculum or the pedagogy or the rules or the routine.  All I know about what my child is doing, or will be doing, either comes from her or what the school chooses to share with me.  Sound familiar?

There is a wonderful freedom that comes without all this knowledge!  As both a parent and an educator, I do have some genuine faith that teachers and schools know what they are doing.  I also know that as my child is now in high school (and I guess not really a “child” anymore), that there is a necessary and natural transition of ownership of her learning more fully to her.  I, too, want her to advocate for herself and I am okay with her school putting up some guardrails to help shift that onus from us, her parents, to her.  I could definitely enjoy not having to know so much about the details of her education and having faith that everything is happening as it should.

Like anyone, I only have the experiences that I have, but I imagine it is fair to suggest that it is not only the differences between K-8 and high school that are in play here, nor is it only the differences between private and public or Jewish and secular.  What I am learning now, in a way I never could before, is how meaningful it is for a school to open itself up to parents.

“Transparency” at OJCS is a core educational value, not a core business strategy.  We don’t seek to be proactive and candid with parents about how and what we do in service of their children because it is good for business.  We don’t seek and use parent feedback because it is good customer service.  We are proactive and candid with parents about how and what we do in service of their children; and we seek and use parent feedback because we eagerly seek parent partnership.  Parent partnership is not a business transaction; parent partnership is an educational relationship.  The “we” in “we own our own learning” includes parents.

The opportunity to actively and meaningfully partner in your child(ren)’s education is not a given in every school.  It is an opportunity, not a requirement, but one we want to inspire, encourage and empower.  We work hard to provide parents with information and access to what is happening in school – about big picture issues and workaday activities.  It can be overwhelming.  My blog posts are too long.  We have too many “Town Halls”.  The OJCS Blogosphere is too complicated to navigate.  We send too many emails and we post too much on social media.

Maybe.

It may be true that you may not want all the details of our new homework philosophy.  You may not want to know how we are going to translate the “7 Habits” into a school-wide behavior leadership program.  You may not want to know the details of the comprehensive PD our French teachers are participating in.  You may not be interested in the details, pictures and videos being generated by teachers and students in class blogs and student blogfolios.  The details of the Makerspace may be more than you care to have at your fingertips.

Etc.

And that’s okay.  Each parent and family can choose for themselves how much they want to know about all the ways we think and work to educate the children in our school.  Just know that we believe you are entitled to that information and, more than that, that your being in the know about the school, and your keeping the school in the know about your child(ren), enhances, amplifies and helps ensure our mutual success.

Speaking of which…

We hope to see many of you on Wednesday, September 25th at 7:00 PM for our AGM followed by our Hands-On Workshop at 7:30 PM.  There we will be doing some hands-on learning, exploring and subscribing that will better help you know exactly how to find the information about your child(ren)’s class(es), including homework/quizzes/tests/projects, you want and need to be wonderful partners and advocates.

We will likely put out some additional information about the workshop (including either an opportunity for folks to participate virtually and/or where to find a recording of it) because we are still actively shaping it in response to feedback from the opening of school.  I realize that that might seem a bit messy, but it is only because we want to make sure that our assumptions about how we prepared for this year are actually borne out in reality.  We want to actively respond to the facts on the ground, not what we assumed to be.  If you have specific questions, concerns or suggestions on the content of the workshop, please don’t hesitate to share them.  We want this to be in service of parents’ felt needs.

Finally, if you need an extra incentive to be with us, please note that we will be making a major announcement that evening on how we plan to secure the long-term future of our school.  It is very exciting and will be a big moment for us and our community.

[And I wrote a blog post under 1,000 words! #LifeGoals]

The Transparency Files: The OJCS Report Card Prototype

The season is upon us!  We are busily filling out report cards and eagerly preparing for parent-teacher conferences.  We are also continuing to innovate and to prototype, so it should be no surprise that a few changes to both are in store.

Let’s first talk about what will not be different about report cards and then what is different…

As we have discussed, the arc of our journey to reinvent and revitalize our school has begun to take shape.  Last year was about values.  We spent significant time clarifying our value proposition which is now expressed in our North Stars.  As we begin to live those values, we are spending this year focusing on strategy.  The strategies we put in place are designed to help bring us closer to our North Stars – they are how we bring “The OJCS Way” to life.  The “7 Habits Prototype” is a strategy that will help us create a community of kindness, drawing us closer to being a place where “each person is responsible one to the other” and where “we learn better together”.  Increased informal educational experiences like the “Middle School Retreat” are a strategy for infusing our community with “ruach”.  The use of Silvia Tolisano and the “Silvia Cohort” is a strategy.  Etc.

What we have launched our journey with, is time spent on the why and how of learning – what do we believe to be true about teaching and learning and what does that look like in a classroom or a school?  What we have not spent time on – nor will we in this year – is the what we are teaching (with the exceptions of Lower School Jewish Studies, which has a new curriculum and Middle School Jewish Studies, which has new benchmarks).  So the one thing that has not changed in our new report card prototype is the what.  You will find the exact same topics and subjects from last year.

Let’s focus on what is really the only meaningful change, the commentary.

Report cards are not the best place to summarize activities or curriculum.  For as long as we use the ministry standards as a floor for General Studies, we can provide parents with more detail than they would ever need about what we are teaching.  Furthermore, our handbooks, our website and classroom blogs provide parents with all the information about topics and activities they need to stay current.  And even if, with all that, there are some curricular highlights we want parents to have top of mind, we can share them at the Parent-Teacher Conferences.  Report cards, therefore, are a place for providing parents with meaningful feedback about their child’s growth.  We are looking for a “less is more” approach that breaks the commentary into two sections: “Feedback” and “Next Steps”.   This approach is a strategy for ensuring “a floor, but not a ceiling” for our students and to give them an opportunity “to own their own learning”.

Let’s give a few concrete examples:

Rachel has earned an “E” in Grade 2 Jewish Studies.

Feedback:
  • Rachel has excelled in her quizzes, homework and projects this term.  She consistently uses Hebrew in class and shows mastery over Jewish Studies content.
  • Rachel has a particular passion for Tefillah and frequently volunteers to serve as prayer-leader.
  • I’ve noticed that Rachel has some difficulty working in groups – when given the choice, she almost always prefers to work alone.
Next Steps:
  • I would like to see Rachel push herself even more with her conversational Hebrew.  I am going to create a Voicethread account for Rachel so that I can give her a few conversational prompts a week for her to orally respond to.
  • Next term, I am going to assign Rachel a few more complicated prayers that I know she is capable of learning.  
  • We are going to spend time next term skill-building around group learning so that Rachel can benefit from others and others can benefit from her.
 
Michael has earned a 65% in Grade 5 Language Arts.
 
Feedback:
  • Michael was benchmarked at a 4.2 (Grade 4, Two months) reading level on his last reading assessment.  This represents appropriate growth for Michael based on his end of Grade 4 assessment (4.0) and is consistent with his IEP.
  • Michael’s oral expression continues to surpass his written expression, but he is finding success with the voice-to-text accommodation we have made this year per his IEP.
  • I am concerned that based on his homework, quizzes, and tests – even with accommodations – that Michael is not putting in enough time at home to be as successful as he is capable of being.
Next Steps:
  • I would like to see Michael expand his reading repertoire to include more just-right books and more genres (he tends to stay with graphic novels).  This will help him continue to grow as a reader next term.
  • While we continue to make appropriate accommodations, I do want to see Michael take the next steps with his writing, which will focus on writing strong paragraphs, with a topic sentence and supporting sentences.  
  • I would like to work with you and Michael on establishing successful study habits at home so that he has every opportunity to present his best work.
Solomon has earned a 78% in Grade 7 Math.
 
Feedback:
  • Solomon received an 83% on his Unit Test, averages 74% on his quizzes and tests, and dutifully completes homework and participates in class.
  • I’ve noticed that Solomon’s written work doesn’t always reflect his ability to explain math concepts.  I have observed in class that he does not always check and recheck his work before turning in assignments and tests.
  • Solomon is having particular difficulty with multistep word problems.  He has the necessary computational skills, but sometimes cannot unpack word problems into their appropriate steps.
Next Steps:
  • I will encourage Solomon to employ new strategies for checking his work (such as putting a check mark next to each one he has rechecked) to ensure he is putting forth his best effort.
  • I am going to provide Solomon with individualized word problems this term – and will conference with him – to help him build skills.
  • Here is a link to a section of Kahn Academy that I encourage Solomon to visit if he is interested in pushing himself.  I believe Solomon has the ability to be an “A” student if he puts in the time!
Last thing…based on strong feedback we will be emailing report cards to parents on Friday, November 23rd.
The Bonus Middle School Parent-Teacher Conference Prototype

We are also very excited to introduce a new prototype for Middle School Parent-Teacher Conferences that we think will go a long way towards ensuring that these important conversations are aligned with our “North Stars”.  This new format will provide parents with meaningful and actionable feedback, and provide us with the same in terms of inviting valuable feedback from parents – all in the service of helping our students “own their learning” and that there be “a floor, but not a ceiling” for each student.

With a large number of middle school students and a fair number of middle school teachers, we are going to try to provide a larger window of time with a more strategic number of mutually selected teachers.  Instead of signing up for individual conversations with any or all teachers, we are going to be asking for parents to sign up for a 15-minute window and a request for one or two teachers they feel strongly need to be present.  Then we will meet as a full middle school faculty and assign teachers to each middle school conference, using parental request and who we believe to be important in the conversations that should happen to best support each child.

We are very excited about this change and the kinds of conversations we believe it will yield.  Please know that our parents are always welcome to schedule meetings with any and all of our teachers – before or after parent-teacher conferences.  If you have additional questions or concerns, you are encouraged to let us know!