

Looking out my office window at the sunny skies [when I first wrote this on Tuesday afternoon!], is both a reminder of the first stirrings of normalcy and what we hope next year and beyond will bring… as atypical as this third year of COVID has been, we do find comfort in familiar habits and experiences. And so if it is May, it must be time to share the results of this year’s Annual Parent Survey. If you would like to see a full comparison with last year, you can reread those results or have them open so you can toggle back and forth. In this post, I will try to capture the highlights and identify what trends seem worth paying attention to.
The first thing to name, which does not come as a tremendous surprise considering the times we are living through, is that we continue to have a less-than representation. In fact, it seems that the more we grow, the percentage of students represented by the survey decreases. Our enrollment has grown each year that I have been here, but our survey has gone from covering 81 students to 84 students to 54 students to 58 students to 52 students. That means that this year’s survey represents barely more than a quarter of our student population! As the survey is per student, not per family, it runs the risk of being even less representative than that. (In the service of anonymity, we have no way of knowing how many families the survey actually represents.) Our goal of 50% seems more and more unrealistic each year. [If you have feedback on what might incentivize greater participation, please drop it in the comments or email it to us directly.]
I simply no longer know if or how to draw meaningful conclusions about participation rates. Whereas it is common wisdom that folks with concerns are usually more likely to fill out these surveys, there is no common wisdom when it comes to pandemic times. So for what we hope is one final year, instead of worrying about the motivations for why families did or didn’t fill out surveys, let’s celebrate the parents who did participate and try to make meaning of what they are telling us.
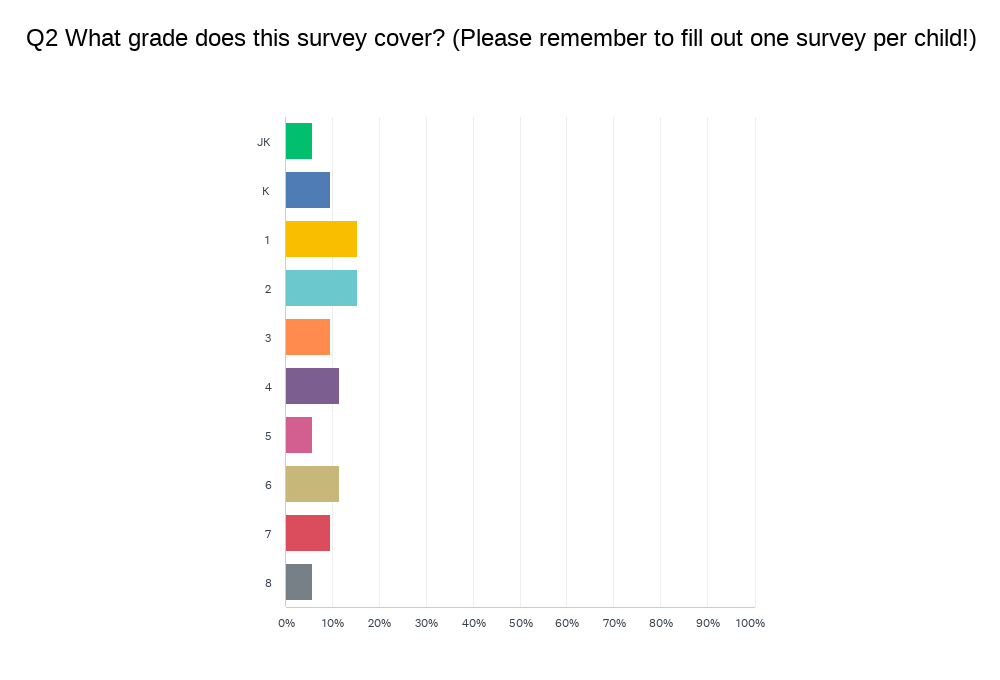
For the second consecutive year, we have more spread than normal. It is more typical to have a big cluster in the youngest grades with diminishing returns as you get older. Again this year, we have a healthy distribution across most of our grades.
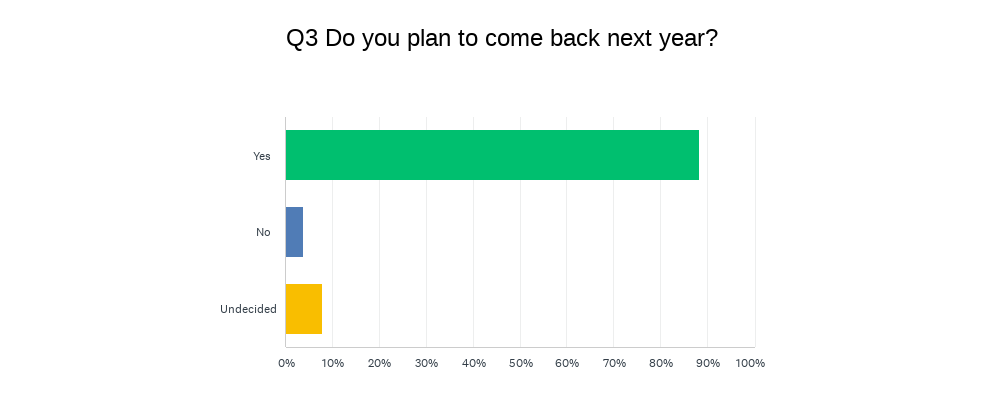
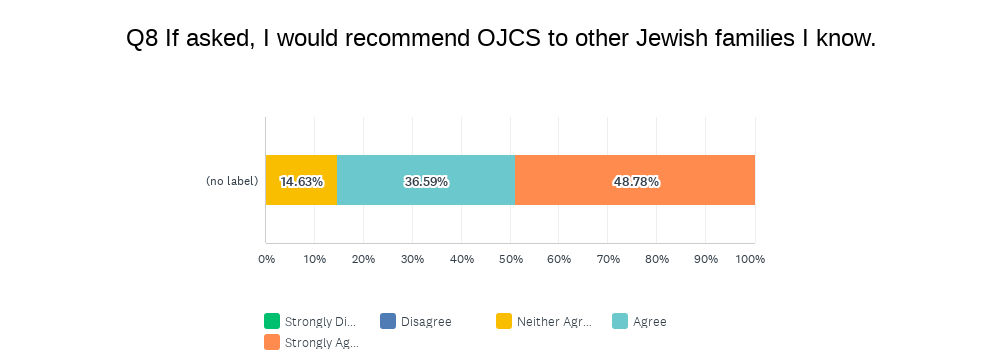
Without knowing how representative this quarter of students is, this data for sure lines up with what is true – that we have, again, had a fast and successful re-registration. The percentage who replied “yes” is up and the “noes” are always complicated to unpack because we have no way of knowing who of the “noes” represent graduations or relocations, as opposed to choosing to attrit prior to Grade 8). What continues to be true is that the overwhelming majority of families – regardless of their feedback – stay with us year-after-year. This continues to say a lot about them and a lot about us.
Let’s look at the BIG PICTURE:
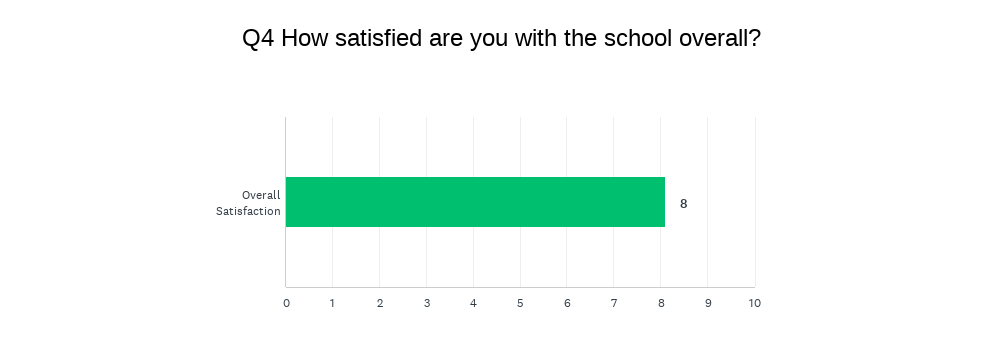
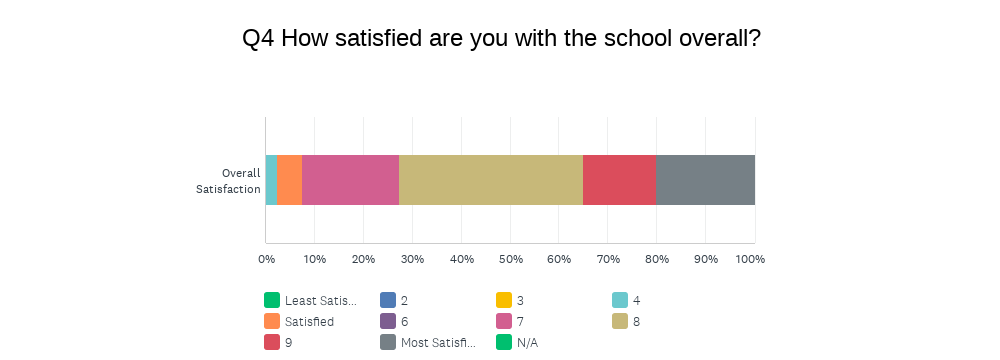
The first chart gives you the weighted average satisfaction score (out of 10); the second chart gives you the breakdown by category. I will remind you that for this and all categories, I look at the range between 7-9 as the healthy band, obviously wanting scores to be closer to 9 than to 7, and looking for scores to go up each year. In terms of “overall satisfaction”, we have now gone from 7.13 to 7.20 to 8.17 to 7.91 to 8.0. Although it is just a tick up from last year, the difference is statistically insignificant. This is just the second time that no families graded the school a 1, 2 or 3. Of course, we always want to see numbers continue to go up, but based on how we survey it is hard to get much higher.
This continues to be a good news story, but let’s dig deeper…
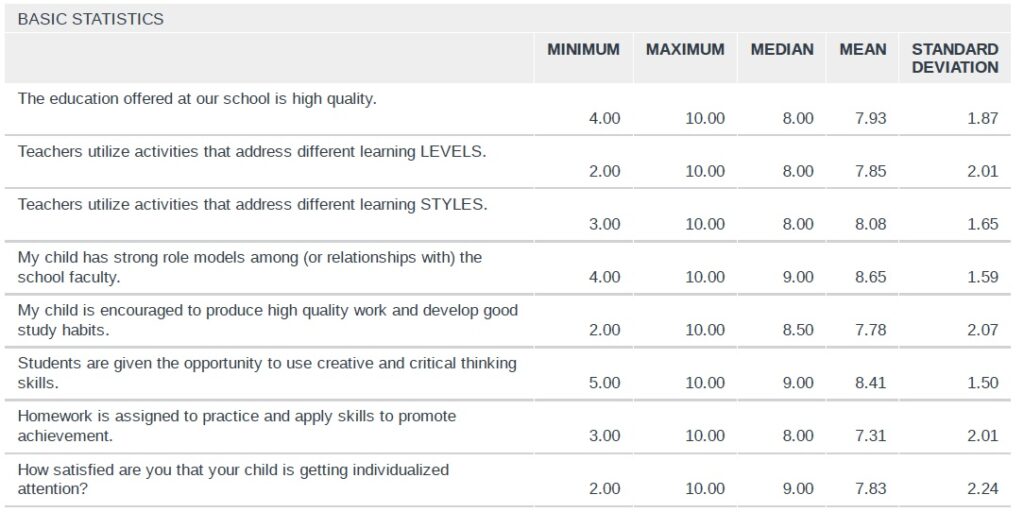
- The topline number – probably the most important – like our overall satisfaction is slightly up 7.91 to 7.93 and a very positive outcome.
- I am very pleased to see that every single category is up from last year’s all-time highs and that each score is well within the healthy range!
- I am thrilled to see that relationships with faculty again comes in with the highest score (8.65) in this block, especially when you factor in all the challenges the of pandemic have created. Kudos to our teachers!
- Our lowest score (again) is again in “Homework” but it does continues to climb from 6.56 to 6.91 to 7.0 to 7.31. Progress has been steady, and we are seeing steady improvement in the full implementation of our new Homework Philosophy.
- I am thrilled to see such a high score (8.41) for “creative and critical thinking skills”…that is very much #TheOJCSWay.
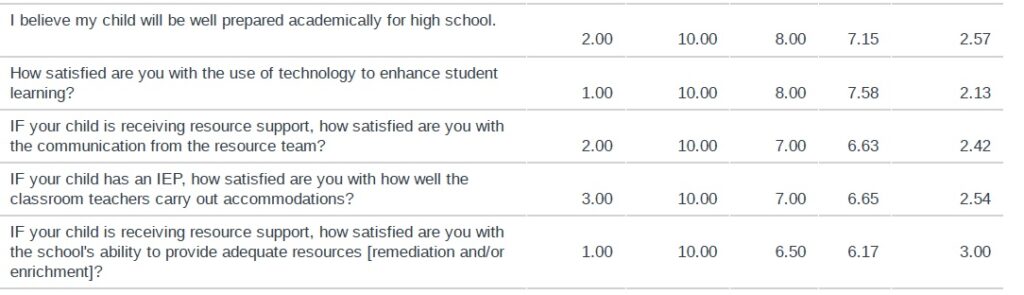
- After having seen steady growth on the topline number, which again is so critical to our school, it is a bit disappointing to see a drop. We have gone from 6.61 to 6.97 to 7.58 to 7.15. It remains well within the healthy range, but we will be looking to get back on the upward track next year.
- The metrics for Spec Ed are a bit of mixed bag with the communication score holding steady, but the satisfaction score for those who have IEPs dipping just a bit. The numbers remain strong and of all the things to suffer during the pandemic, it is not surprising to see it impact our most vulnerable students. Kudos to Sharon Reichstein, our Director of Special Needs Education, and her new team for all their work this year!
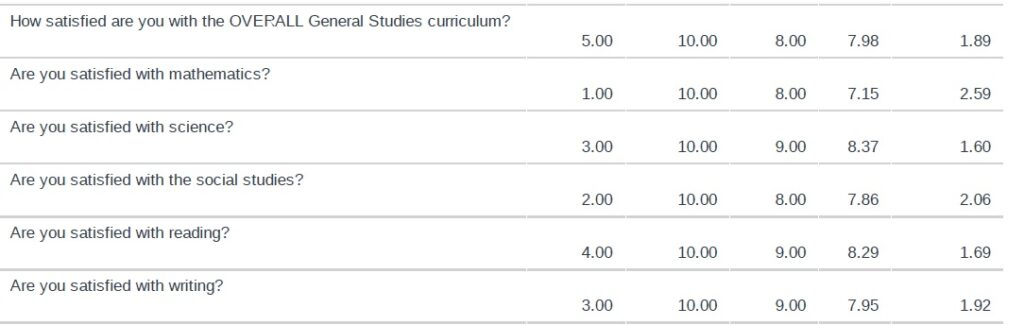
- Thrilled to see that our topline number continues to remain (essentially) at 8!
- Very happy to see that every metric in General Studies is well into the healthy band and each one is essentially unchanged.
- Math: 7.09 to 7.60 to 7.67 to 7.15.
- Science: 7.09 to 7.72 to 7.61 to 8.37.
- Social Studies: 7.41 to 7.96 to 7.95 to 7.86.
- Reading: 6.93 to 8.0 to 7.85 to 8.29.
- Writing: 6.51 to 7.07 t0 7.41 to 7.95
- The biggest movement this year, which I am thrilled to see is “Science”, where we have invested precious bandwidth in Hackathons and Innovation Day and reopening the OJCS Makerspace, and in “Reading” where we have, not coincidentally, a number of teachers focusing on their professional growth. This is a clear example over time where parent voice, aligned with teacher and student voice, leads to meaningful action. (Fill out those surveys y’all! We really do pay attention.)
- I am also very pleased to see “Writing”, like “Reading” continuing on a strong upward trajectory over the last four years.
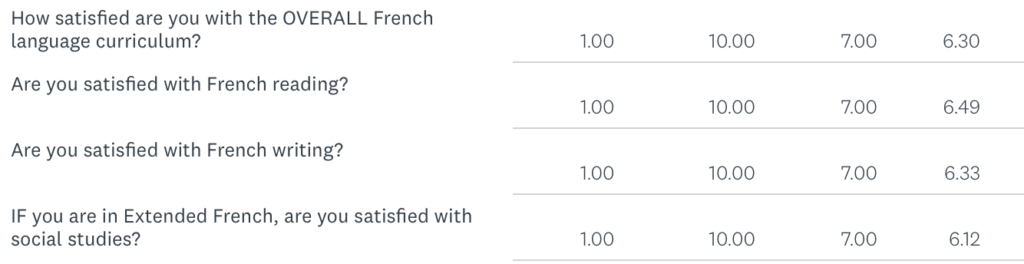
- I am pleased to report that despite another year of COVID functioning and the continued integration, that the quarter of students represented in this survey are reporting steady numbers for French outcomes.
- We would like to believe that the result of our TACLEF consultancy is continuing to pay dividends and that our recent announcement of expanding our French program to incorporate French-language physical education will help these numbers continue to tick up in the years ahead. Bon travail to the French Department!
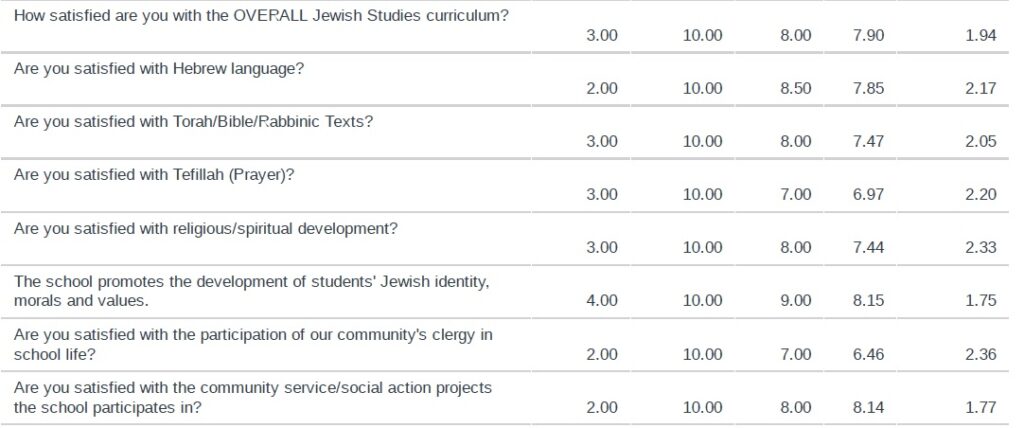
- We are again thrilled to see all our Jewish Studies metrics continue to hold strong for another year. We are especially pleased to see the OVERALL metric essentially hold steady from 7.29 to 8.08 to 7.91 to 7.90. Considering, that we again went forward without filling the “Dean of Judaics” position and all the additional COVID-related challenges, this is especially encouraging. Kol ha’kavod to the Jewish Studies Department!
- I am taking the slight dip in “Tefillah” as a personal challenge! It is my favourite subject to teach (students) and to coach (teachers) and I am going to make it my mission to push prayer past 7.0.
- I am also going to – assuming a return to normal – encourage our community’s rabbis to resume a greater role in Jewish life at OJCS.
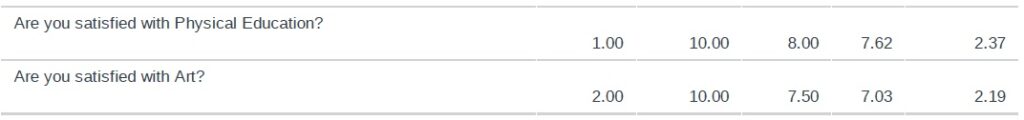
- Considering the circumstances, it is both surprising and positive that with all the protocols that were in place that we’d see growth in both Art and PE – both of which have reentered the healthy band. We know that even with a rigorous, trilingual curriculum, that we need to continue to offer the kinds of high-quality PE/Drama/Art experiences that make a well-rounded education. We said last year to “look for these numbers to go back up next year”. Mission accomplished!
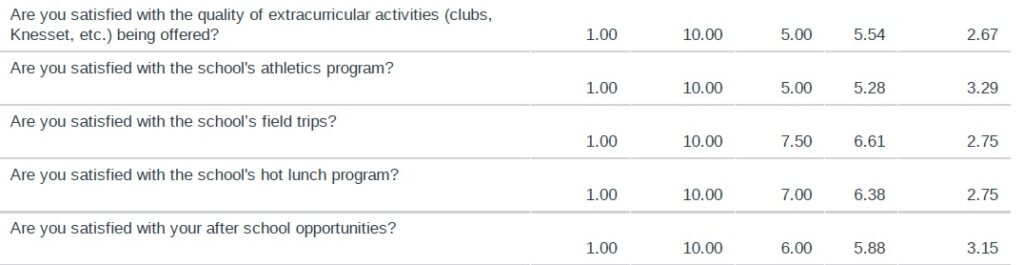
- It is worth noting that even though none of our extracurriculars, athletics, hot lunch, etc., programming has reached pre-COVID numbers (understandably) they are all up from last year…with lots of room to grow.
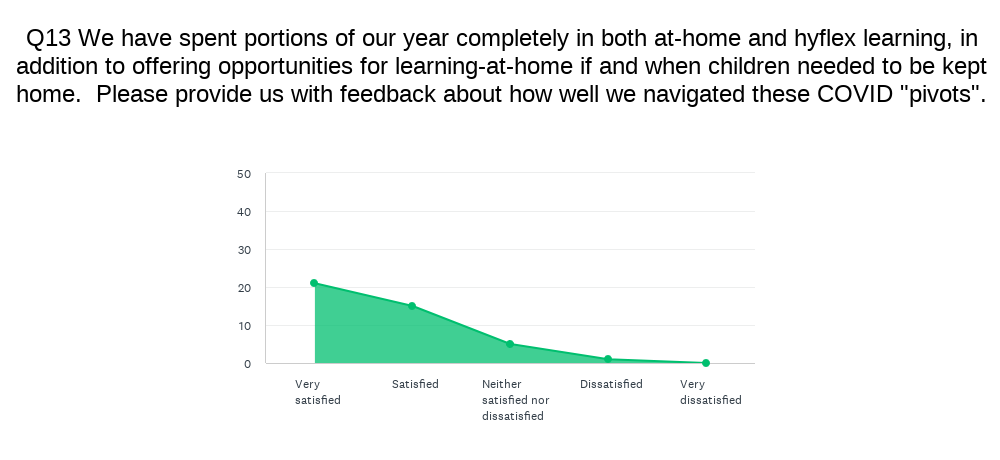
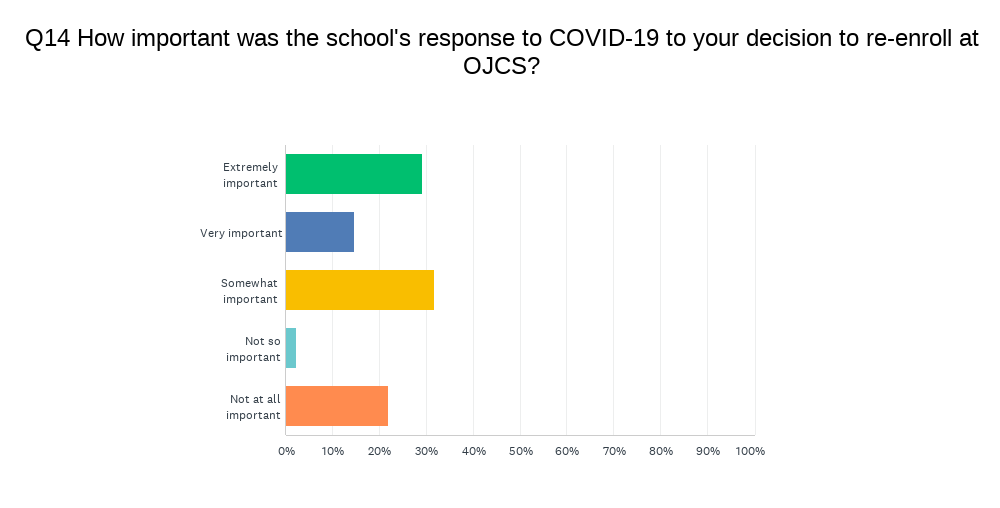 From this year’s experimental section, we yield these two data points (and two sets of meaningful commentary). Compared to last year, there is a larger cluster in “very satisfied” and “extremely important” – which is likely not a coincidence. As we cannot predict the future, even with wholehearted hope of a return to year-round, in-person learning next year, our ability to navigate situations like these last few years with minimal disruption and maximal academic progress – not to mention the continuance of meaningful Jewish experiences – will likely continue to be powerful value-adds for OJCS in the years ahead.
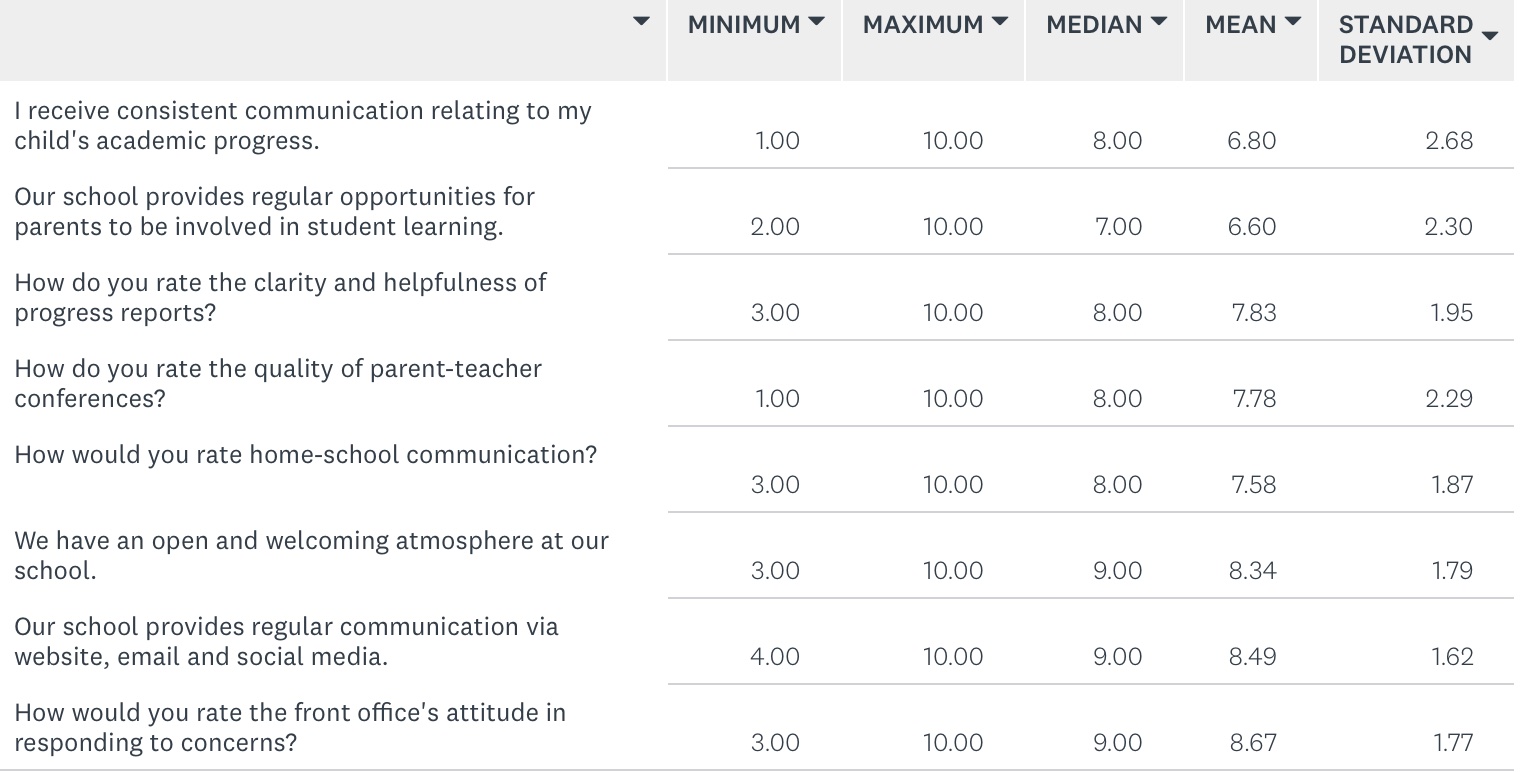
- These are mostly wonderful scores, all just about the same and well into the healthy ranges. We know that we have Ellie to thank for a lot of those high scores!
- I am sadly saying again this year, that, “[a]fter having to take a COVID pause, I will be interested to see what the impact of ‘Student-Led Conferences’ will be on the ‘parent-teacher conferences’ metric once finally launched.
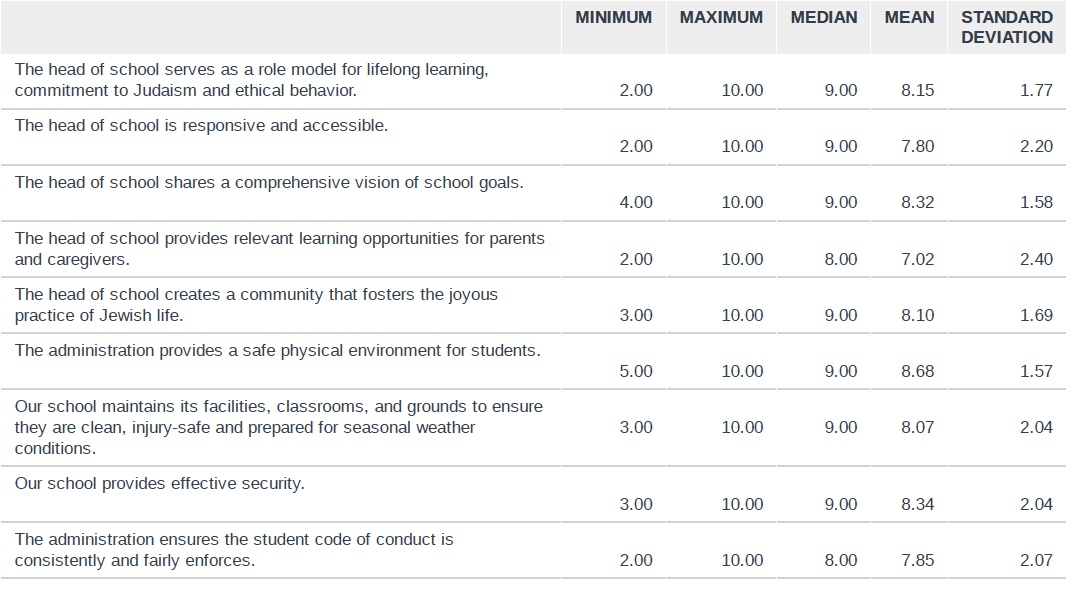
- I have already shared my thoughts on my own job performance in my prior “Transparency Files” post. I will simply state here my pleasure in seeing my numbers holding strong, with the weakest one – providing learning opportunities for parents and caregivers with some health post-COVID room to grow.
- The one metric that I am very pleased to see holding strong is the last one, which essentially serves as a proxy for school-wide behavior management. Three years ago we scored a 6.69 and I stated that, “we are working on launching a new, school-wide behavior management system next year based on the “7 Habits” and anchored in our “North Stars”. I will be surprised if this score doesn’t go up next year.” Well, two years ago it came in at 7.65, last year it climbed up to 8.19, and it remains high at 7.85 this year.
Last data point:
Remember this question was scaled 1-5. Our score remains consistent from 4.44 to 4.34 to 4.34 (again). I have said that I truthfully don’t know how much more there reasonably is to grow here, but we’ll keep doing our best to find out!
So there you have it for 2021-2022!
Thanks to all the parents who took the time and care to fill out surveys! In addition to the multiple choice questions, there were opportunities for open-ended responses and a couple of experimental sections. Your written responses added an additional layer of depth; one which is difficult to summarize for a post like this. Please know that all comments will be shared with those they concern. (This includes a full set of unedited and unredacted results which goes to the Head Support and Evaluation Committee of our Board of Trustees.) As you can see, we really do use this data to make enhancements and improvements each year.
We very much wish to continue into next year, this year’s trend in maintaining and increasing positive outcomes and satisfaction. To mix school metaphors, each year simply becomes the higher “floor” we stand upon to reach towards our North Stars. With no ceiling, we aim to reach a little closer each time.
Yay for Student Led Conferences!
Hope you are doing well.
PS- my granddaughter, Shayna, who is three just completed her first year at DuBow and loved every minute.
Thank you for your leadership when you were at MJGDS. I look back now and see how great our school truly was.
“Wow” to all of that!
For what its worth, a common way to incentive participation in survey research is to simply pay people to participate. Even a token payment, such as a $5 Amazon gift card per survey response, can significantly increase participation. You might want to give people codes for each of their children needed to unlock the survey, or some other way of preventing people from filling in the survey 20 times, which sometimes happens in survey research. Just a thought.
I have been thinking that we would likely have to move towards an incentive in order to goose participation…one way or another, we’ll be looking to get the number of families on the rise next year. Thanks for the suggestion!