

This is it…the last…the very last…
…this version of the Annual Parent Survey will be put to bed. Faithful readers will recall that last year’s was going to be the last, but October 7th and the relocation/renovation rendered that a bit of a bridge too far.
So, yes, this is it. This Annual Parent Survey has served me and my school(s) well these last 15 years, but the people have spoken – er, rather, I guess, the people have not spoken, or at least have not been willing/interested in completing this survey in this format and so we will finally bid it adieu…
We have found ourselves in this fascinating cycle where each year the enrollment goes up and the participation rate in the Annual Parent Survey goes down. This year, although 47 individual surveys were turned in, only 36 individual surveys provided data on the main sections. That means this survey only represents 19% of the students in our school. It simply defeats the purpose of gathering feedback in service of making decisions that impact students if 1/5 of students are sharing that feedback. Whether we move to a third-party vendor, a new format for surveys, focus groups or some combination therein, we will cast a different and a wider net to ensure we truly capture the feedback we need – and your children deserve – to aim closer to our North Stars; to be the best version of ourselves we can.
But that’s the future…for now, one last time, let’s thank and lean into the parents who did participate and try to make meaning of what they are telling us. [If you would like to see a full comparison with last year, you can reread those results, or have them open so you can toggle back and forth. In this post, I will try to capture the highlights and identify what trends seem worth paying attention to.]
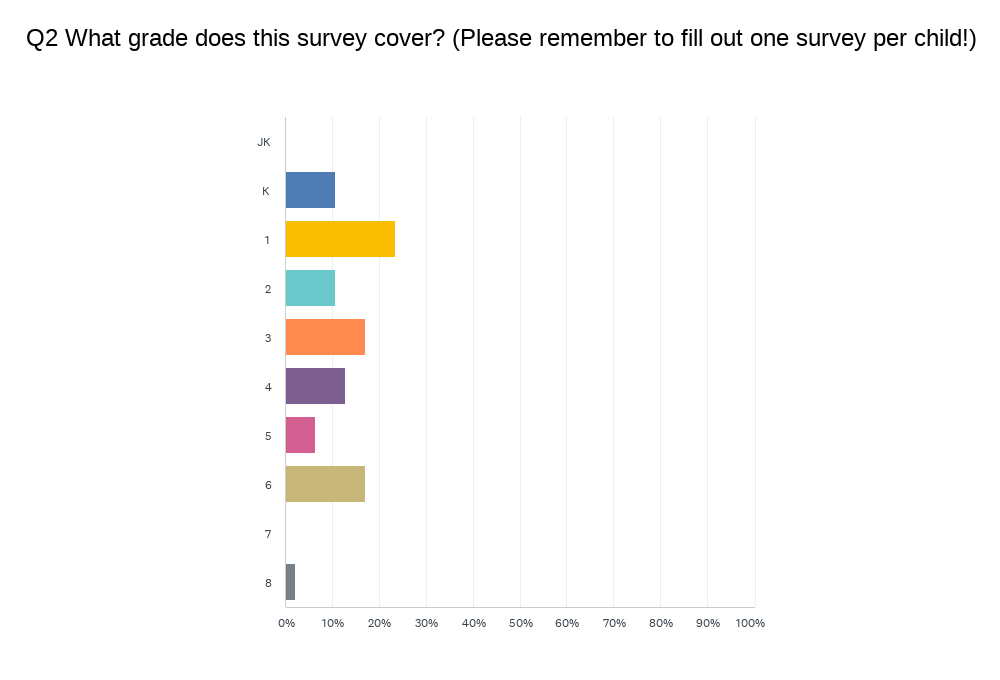
Not surprising to be clustered so low…it does make questions about “high school readiness” less helpful with such little representation from Grades 7 & 8.
 Without knowing how representative this fifth of students is, this year’s data set is lighter on the “no’s”. Of course the “no’s” are always complicated to unpack because we have no way of knowing who of the “no’s” represent graduation or relocations, as opposed to choosing to attrit prior to Grade 8. However, what continues to be true is that the overwhelming majority of families – regardless of their feedback – stay with us year-after-year. This continues to say a lot about them and a lot about us.
Let’s look at the BIG PICTURE:
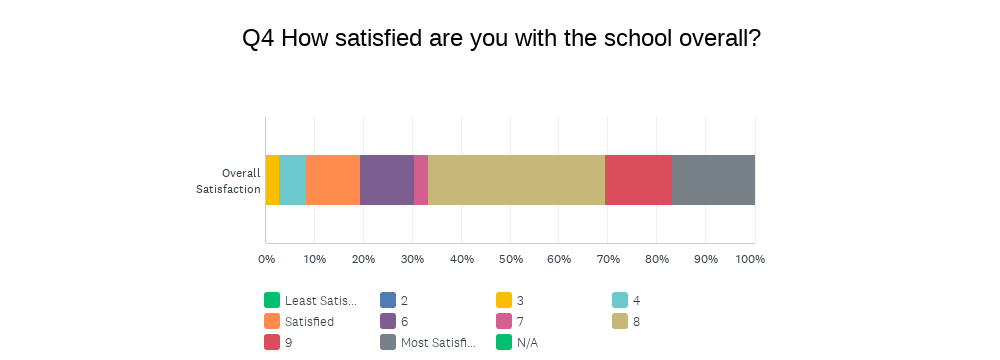
 The first chart gives you the breakdown by category; the second chart gives you the weighted average satisfaction score (out of 10). I will remind you that for this and all categories, I look at the range between 7-9 as the healthy band, obviously wanting scores to be closer to 9 than to 7, and looking for scores to go up each year. In terms of “overall satisfaction”, we have now gone from 7.13 to 7.20 to 8.17 to 7.91 to 8.0 to 7.44 to 7.53. Although it is a tick up from last year, the difference is statistically insignificant.
Overall, this seems to be a good news story, but let’s dig deeper…
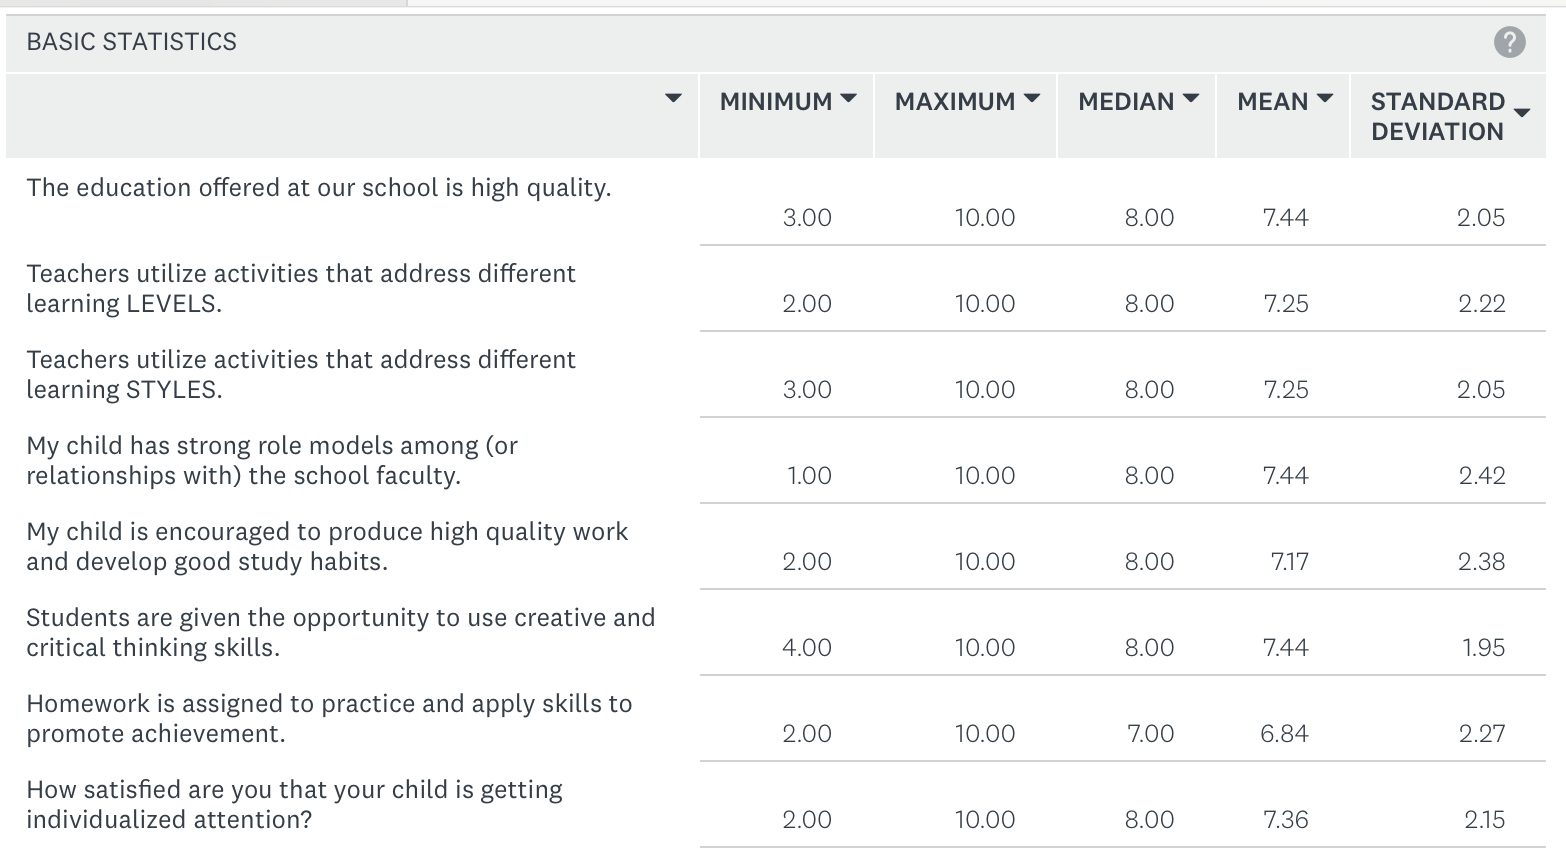
Almost every one of these numbers are up from last year! And the only number that is below the “acceptable range” is trending upwards…

Again everyone one of these is higher than last year! And, again, the only one that is below the “acceptable range” is also trending upwards…
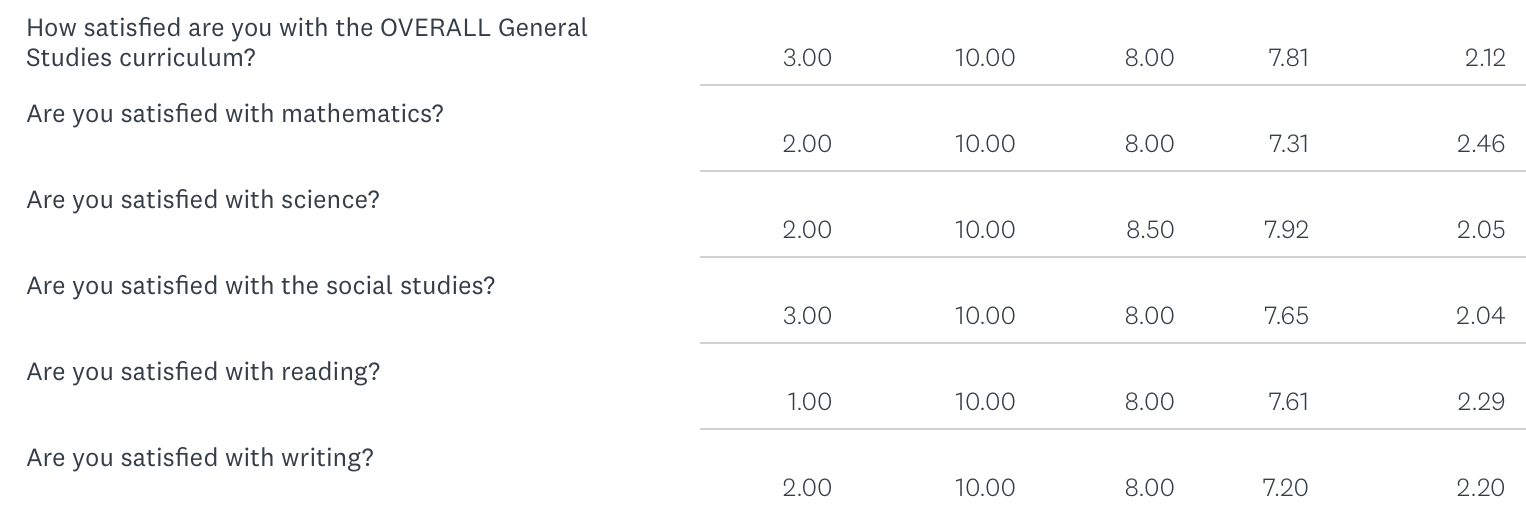
So far, same trend. Every number is up and the OVERALL number and the Science number are as about as high we’ve ever had.
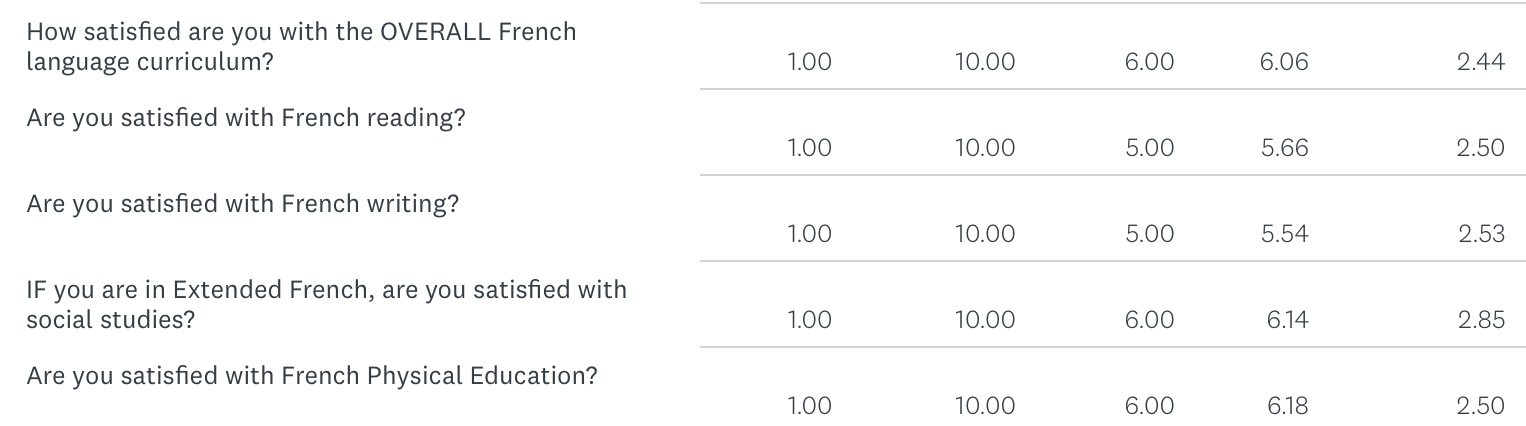
Here we hit our first trouble spot. The less-than-great news is that these numbers, at least for those families who filled it out, are all (still) below the acceptable range. The not-as-bad news is that numbers are fairly flat. “French reading” is down pretty significantly and “French PE” in its second year took a dip as well, so there continues to be meaningful work ahead.

Overall these numbers are mostly flat with a few small dips. Again, anything in those “high sixes” are targets for improvement. [I’m looking at you Tefillah which I take the most personally since I teach it!]

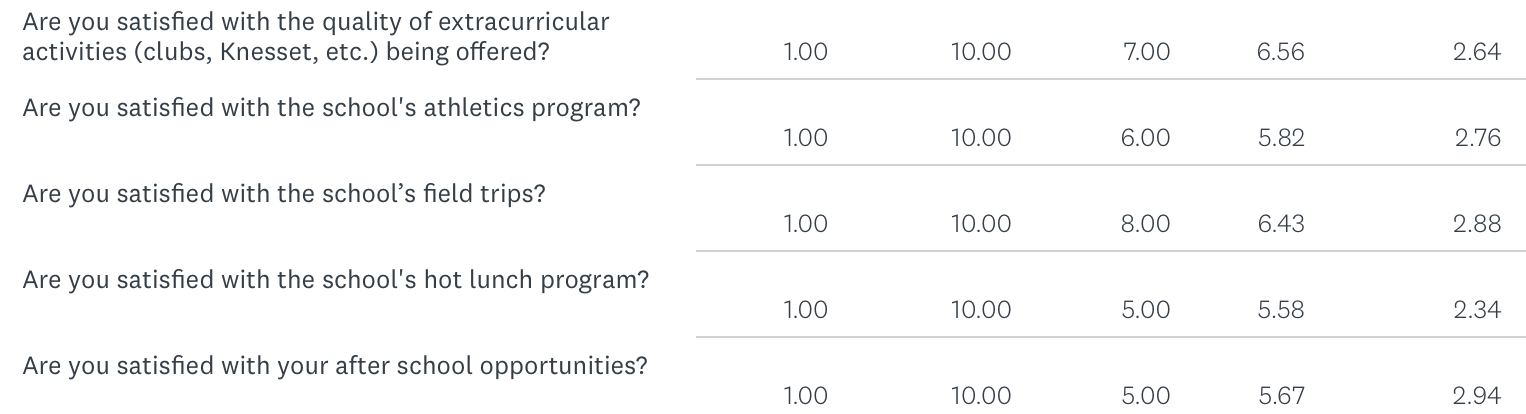
Work to be done! Although we think the transition we made in Art and the addition we made to Music (not yet represented in the survey) has brought significant improvements to our program. There are variables here that are not entirely within our control, but this entire section is worth our thinking more deeply about and identifying a few changes for next year.
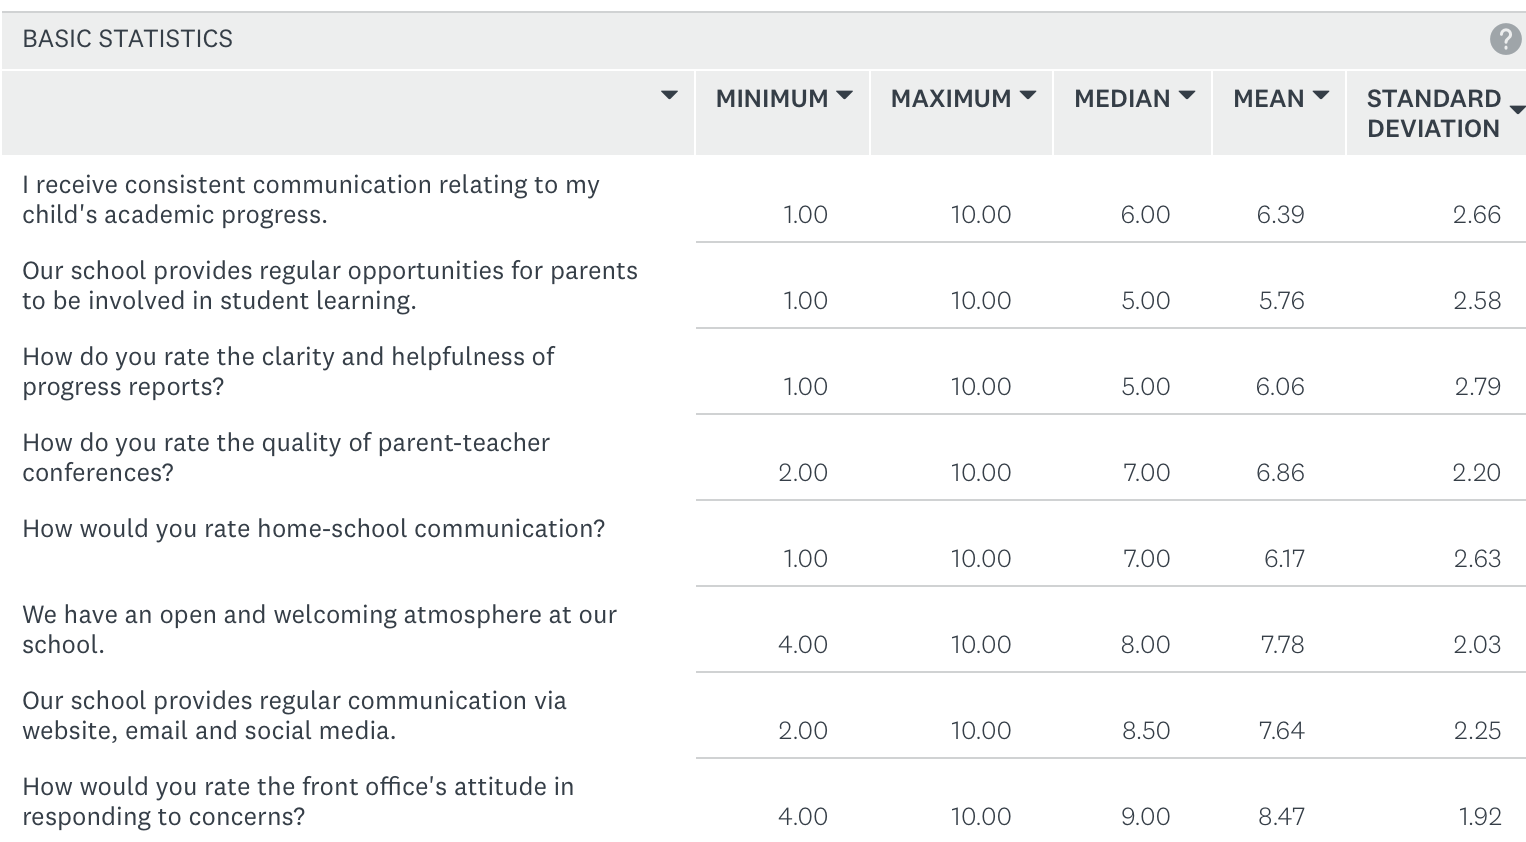
These scores are mostly down as well. Pairing this with comments, we know we have work to do when it comes to the transition to semesters, the way we weave in progress reports, how we approach goal-setting, etc. We believe we have a clear path forward and fully expect to see these numbers grow next year. The one score we want to better understand is how parents view “provides regular opportunities for parents to be involved in student learning”. We do this, or we think we do, so part of what has to be sussed out is whether we are providing the right or preferred opportunities.
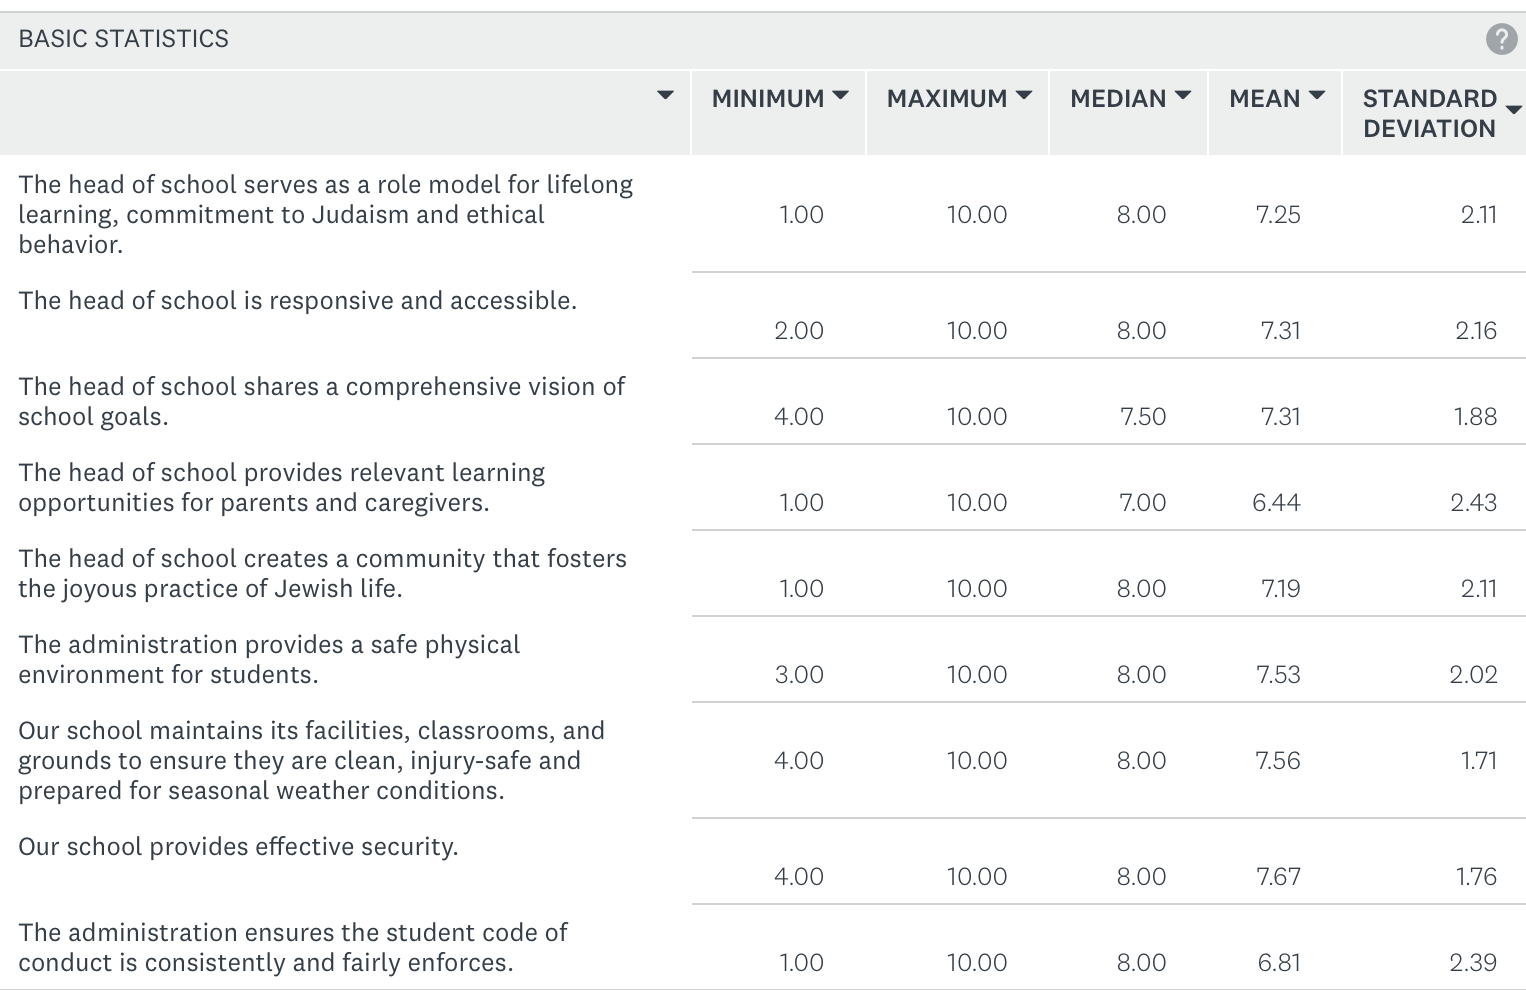
These numbers are almost all higher than the prior year. The two that are below the acceptable range (relevant learning for parents) and (student code of conduct) are both up, if not yet where we prefer them. Considering how much energy we put into new behavior systems this year, I would liked to see that number jump higher, but we will keep working to improve.
Last data point [Remember this question was scaled 1-5.]:
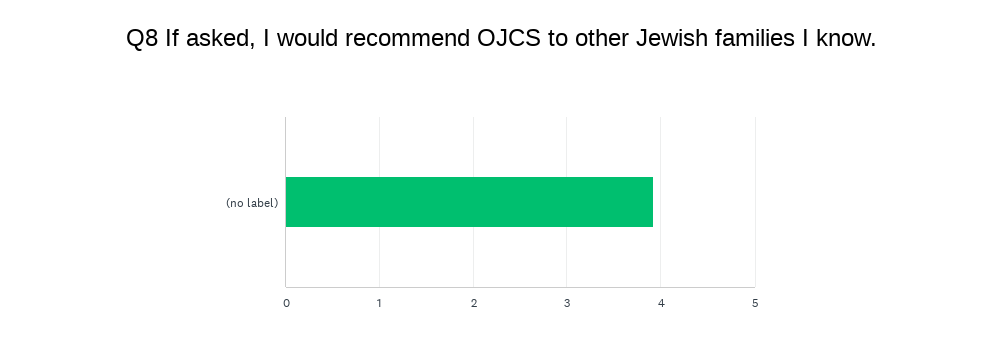
Our score remains consistent from 4.44 to 4.34 to 4.34 to 4.14 to 3.92. This one actually doesn’t jive with the rest of the results which almost universally had higher ratings than the prior year. Could be that this data point, which is supposed to rate Net Promoter Scoring (for those who are familiar) is not well understood. Either way, the trend line is concerning…at least for the minority of families who are represented in this year’s results.
So there you have it for 2023-2024!
Thanks to all the parents who took the time and care to fill out surveys! In addition to the multiple choice questions, there were opportunities for open-ended responses and a couple of experimental sections. Your written responses added an additional layer of depth; one which is difficult to summarize for a post like this. Please know that all comments will be shared with those they concern. (This includes a full set of unedited and unredacted results which goes to the Head Support and Evaluation Committee of our Board of Trustees.)
As I said at the beginning, without meaningful data we don’t know how high to put the “floor” we stand upon to reach towards our North Stars. We will change our model next year to ensure we get better data from more families. That way, we can make sure that without a ceiling, we aim to reach higher each year…