When people think about leadership in schools, they often imagine principals making announcements, board chairs running meetings, or student council presidents handing out spirit day schedules. And sure, those things happen. But if there’s one thing the last eight years at OJCS have taught me, it’s that leadership isn’t about who holds the microphone. It’s about who makes space for others to lead.
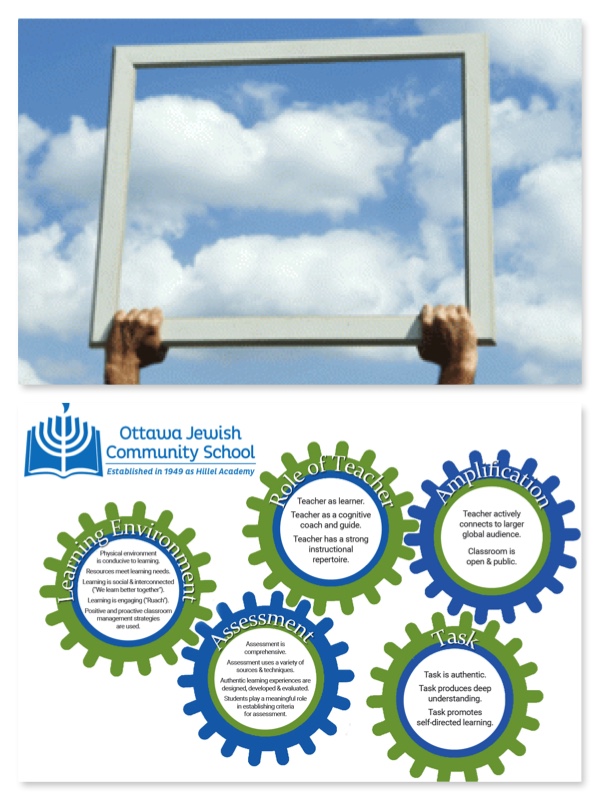
At OJCS, leadership is more than a title—it’s a culture. A culture that runs through students, teachers, administrators, and our governance structures. A culture shaped by trust, transparency, empowerment, and purpose.
This post, the fourth in our “Looking Backwards to Look Forward” series, traces the arc of how leadership has evolved and expanded at OJCS—not from the top down, but from the inside out.
Student Leadership: “We Own Our Own Learning” in Action
Our North Stars say it plainly: “We own our own learning.” That guiding belief is foundational not just to how we teach but to how we raise leaders.
We began by redefining what student government could look like. Our Junior Knesset (Grades 3-5) and Senior Knesset (Grades 6-8) were restructured to provide students with meaningful roles in shaping school life—from Jewish Life to Communications to Environment. This wasn’t just about letting students vote on Dress Down Days. It was about giving them voice and responsibility.
And student leadership didn’t stop at Knesset. We’ve seen remarkable growth in student-led clubs: Bracelet Making Club, Math Club, Game Design Club, and more. These initiatives have emerged not because an adult created space, but because students claimed it.
You can see this leadership captured in real-time on our student blogfolios. In a 2022 Grade 6 post titled “Leading the Way with Knesset”, one student reflected:
“Being in Knesset is more than saying announcements. It’s showing others what our school values.”
That’s the kind of ownership we’re after—not just of learning, but of identity and responsibility.
And, of course, the hoped-for transition to Student-Led Conferences (with Goal-Setting already in place) will, perhaps, be the clearest pedagogical expression of this ethos. When students articulate their own growth, name their goals, and share their work with families, they’re not just learning leadership. They’re living it.
Faculty Leadership: Treating Teachers Like Learners
From the start, we committed to a simple principle:
If we believe students learn best when they have voice, choice, and agency—why wouldn’t the same be true for our teachers?
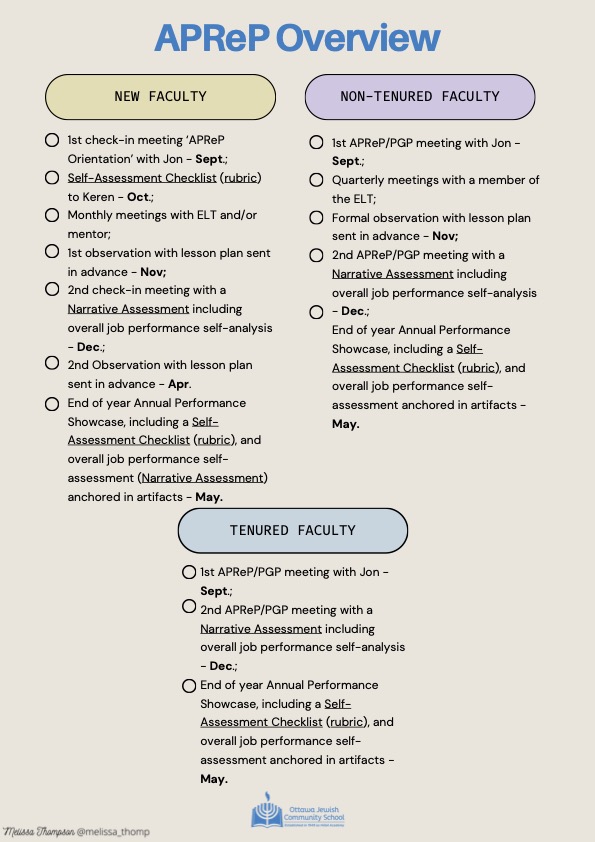
This principle guided our transformation of professional learning at OJCS. It’s why we moved to teacher-led evaluations, why we created the APReP process (Annual Performance Review Process), and why we implemented Professional Growth Projects (PGPs).
Instead of imposing top-down checklists, we asked teachers to reflect, dream, and define what growth would look like for them. As I wrote in How We Grow Our Teachers:
“Our teachers are learners, too. If we are asking them to personalize learning for students, shouldn’t we model the same for them?”
This commitment to faculty empowerment hasn’t just strengthened morale—it’s elevated our teaching. Teachers now co-lead PD, mentor colleagues, and regularly share practice through classroom blogs and peer observations. It has been among the most transformative leadership decisions we’ve made.
Middle Leadership: Tzimtzum and the Art of Making Space
In Jewish mysticism, tzimtzum refers to God’s act of self-contraction to make space for creation. I’ve often borrowed that idea as a leadership model—reframing headship not as “filling the room,” but as creating the room in the first place.
That’s been our approach to middle leadership at OJCS.
Rather than centralizing decision-making in the admin suite, we’ve empowered classroom teachers, coordinators, and administrators from all places on the org chart to lead—from curricular design to scheduling, communication, and culture-building. Whether it’s planning PD, leading committee work, or piloting new initiatives, our middle leaders are central to how the school runs.
And the truth is: when you lead through tzimtzum, you don’t disappear—you multiply. You build a culture where everyone sees themselves as part of the mission.
A few weeks ago, our board chair suggested making sure Ms. Gordon had opportunities to “hold the microphone” during assemblies, as a way of signaling transition. We both laughed. Ms. Gordon has been holding the microphone for years—not because it was handed to her, but because she helped build the stage. That’s what leadership looks like here.
Governance: Leading with Clarity and Care
One of the quieter success stories of my tenure has been the strength of our governance. I inherited a model with built-in advantages: I already knew three of the four board chairs I would eventually work with—not personally, but as community leaders with vision, integrity, and purpose. Each brought a different kind of leadership, and together they modeled what shared responsibility really means.
Governance at OJCS has never been performative. It’s been strategic, transparent, and deeply values-aligned.
Together, we’ve launched multiple strategic planning processes, created structures for board education, improved committee functioning, and clarified roles and responsibilities. Our board hasn’t just supported our leadership—they’ve modeled it. That’s why our faculty, families, and students all feel empowered to lead.
Conclusion: A Culture of Leadership
Leadership at OJCS doesn’t live in a title or a microphone. It lives in the daily decisions to make space—for students to blog, for teachers to grow, for staff to step forward, for lay leaders to partner meaningfully.
It’s also deeply tied to our broader vision for change.
Throughout my time at OJCS, I have tried to follow a leadership arc that begins with naming a challenge, gathering stakeholders, prototyping solutions, iterating with feedback, implementing with support, and creating a new normal. That’s how we approached personalized learning. That’s how we approached French. That’s how we revised homework. That’s how we clarified the “J” in “OJCS”. And that’s how we approached leadership.
As I look ahead to our final two posts—on North Stars and Jewish Life—I’m struck by how much of what we’ve accomplished at OJCS isn’t about any one person. It’s about the culture we’ve built. A culture where leadership is shared. Growth is expected. And everyone has the chance to step forward.
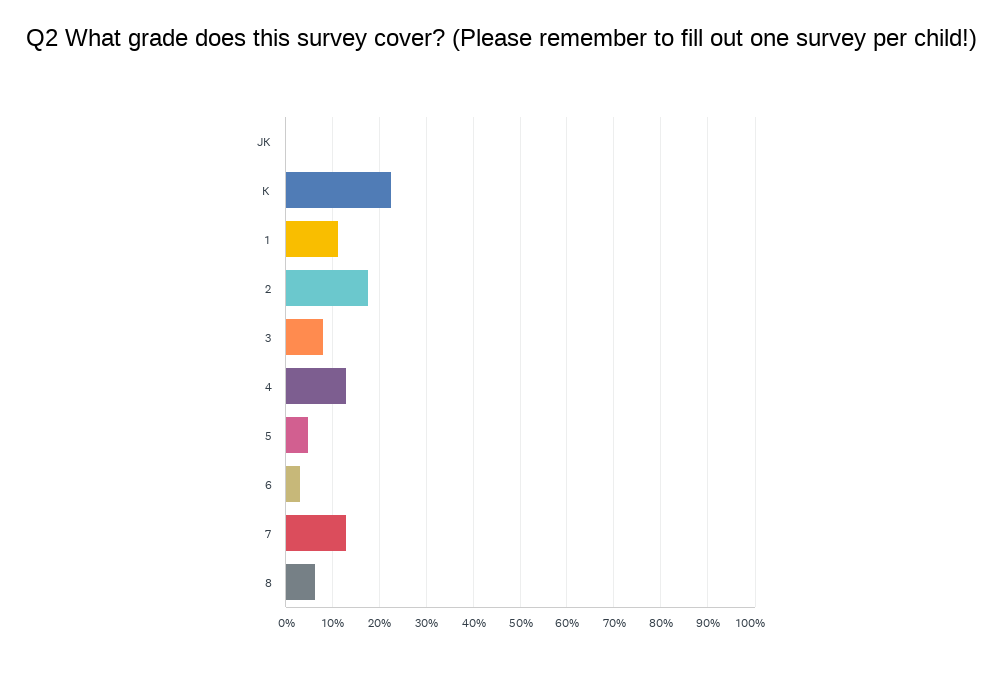
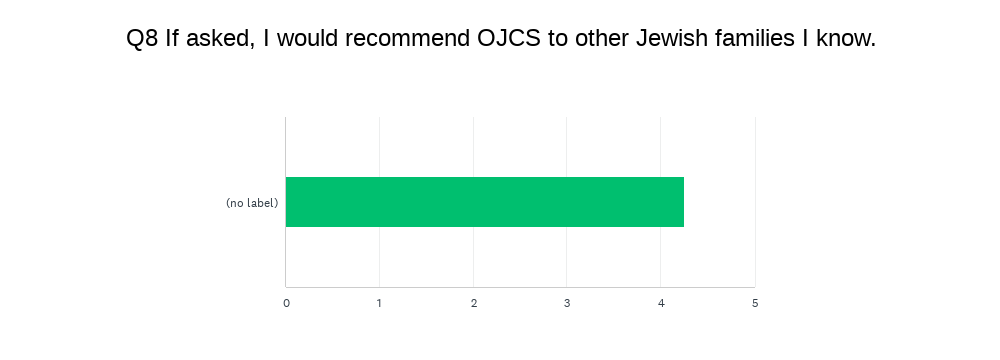
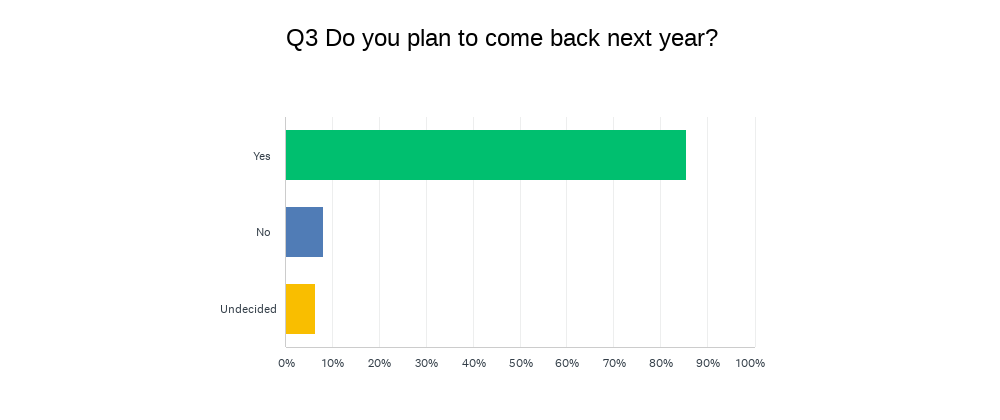 Without knowing how representative this quarter of students is, this year’s data set is lighter on the “NOs”. Of course the “NOs” are always complicated to unpack because we have no way of knowing who of the “NOs” represent graduation or relocations, as opposed to choosing to attrit prior to Grade 8. However, what continues to be true is that the overwhelming majority of families – regardless of their feedback – stay with us year-after-year.
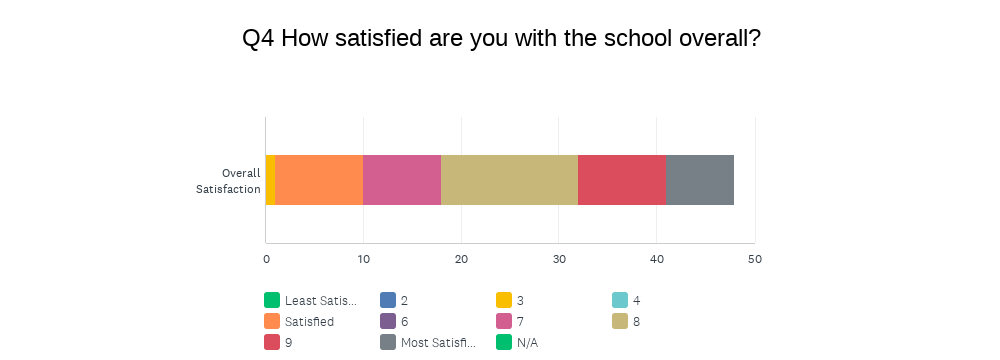
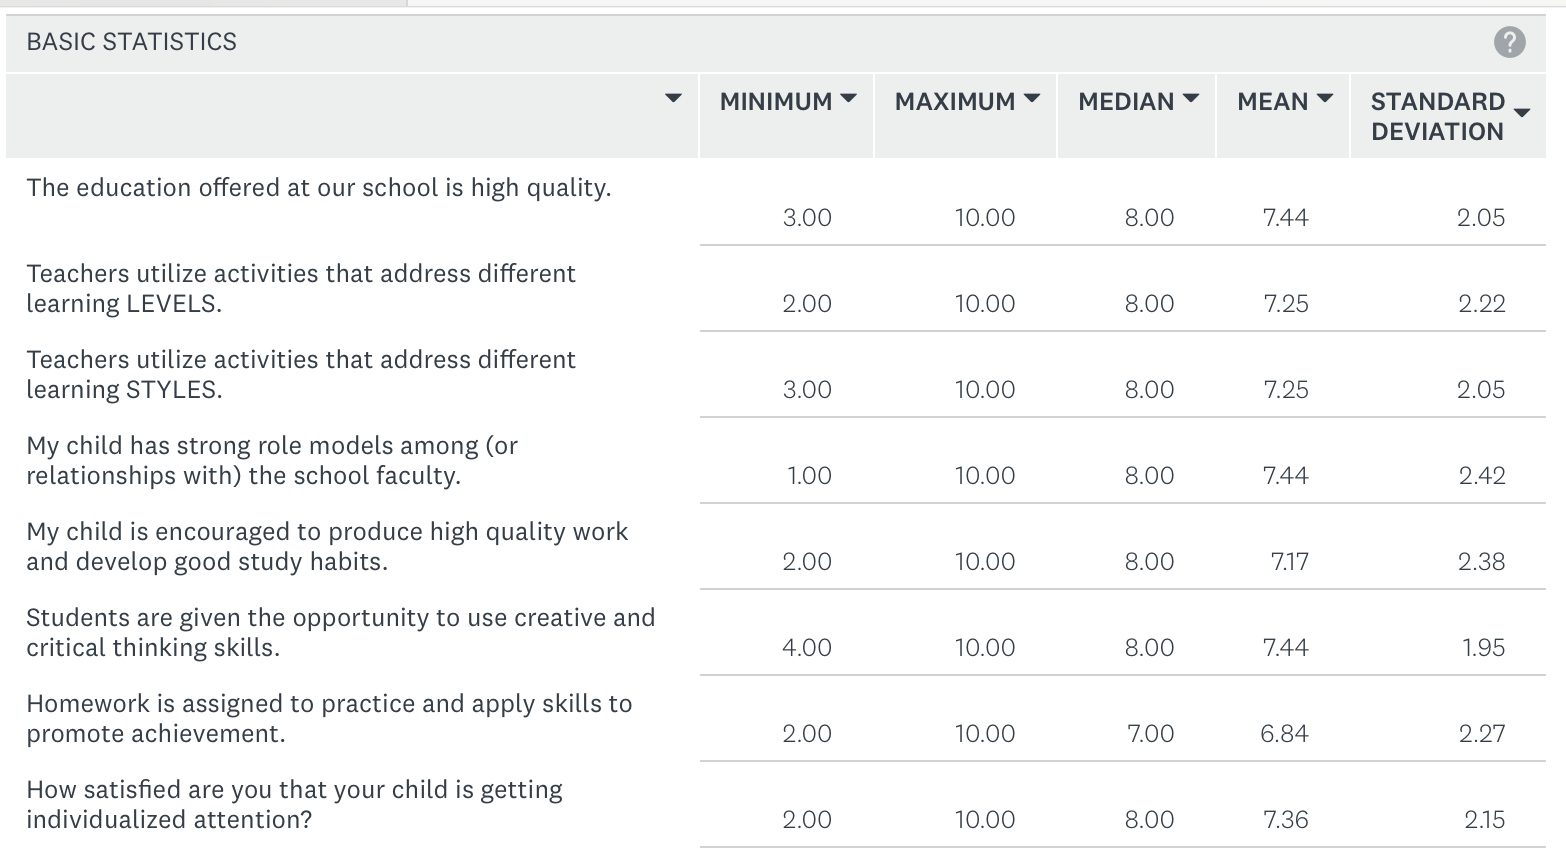
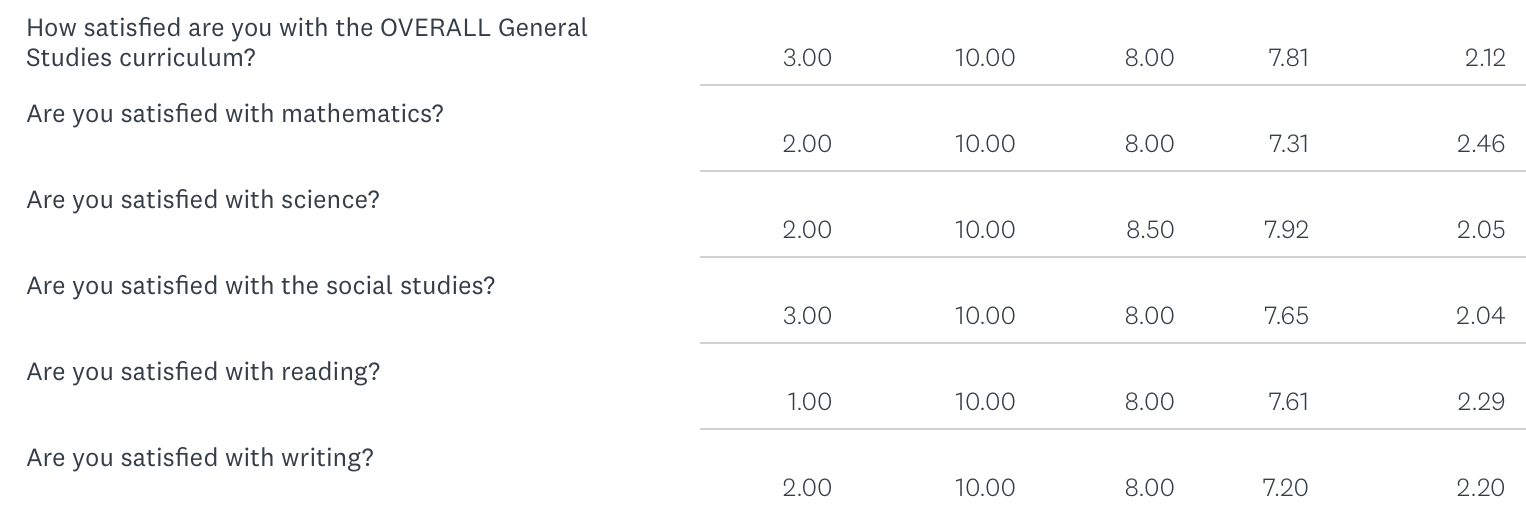
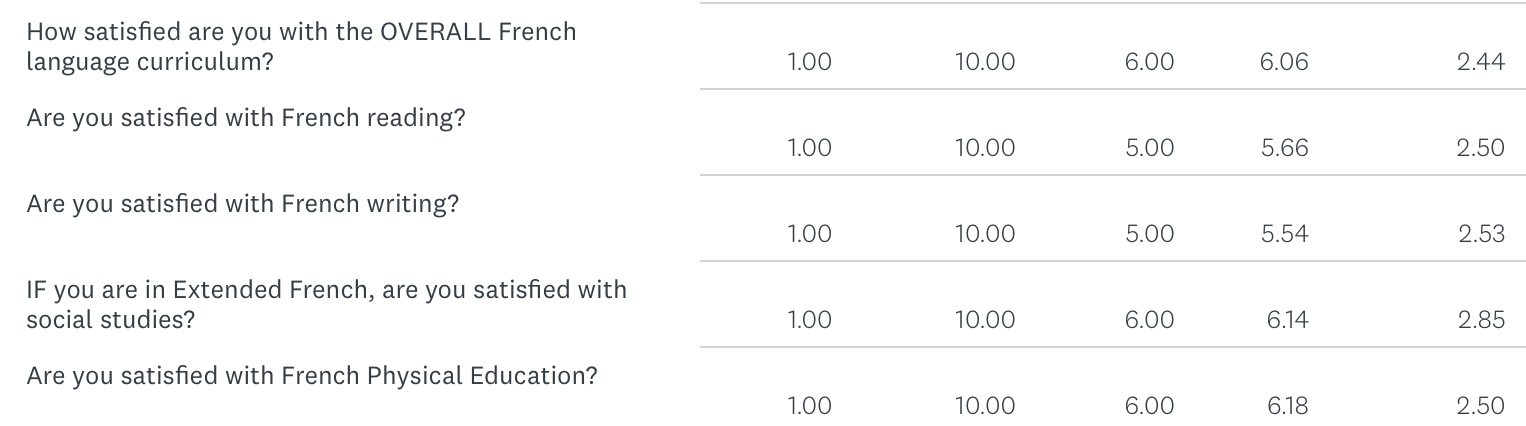
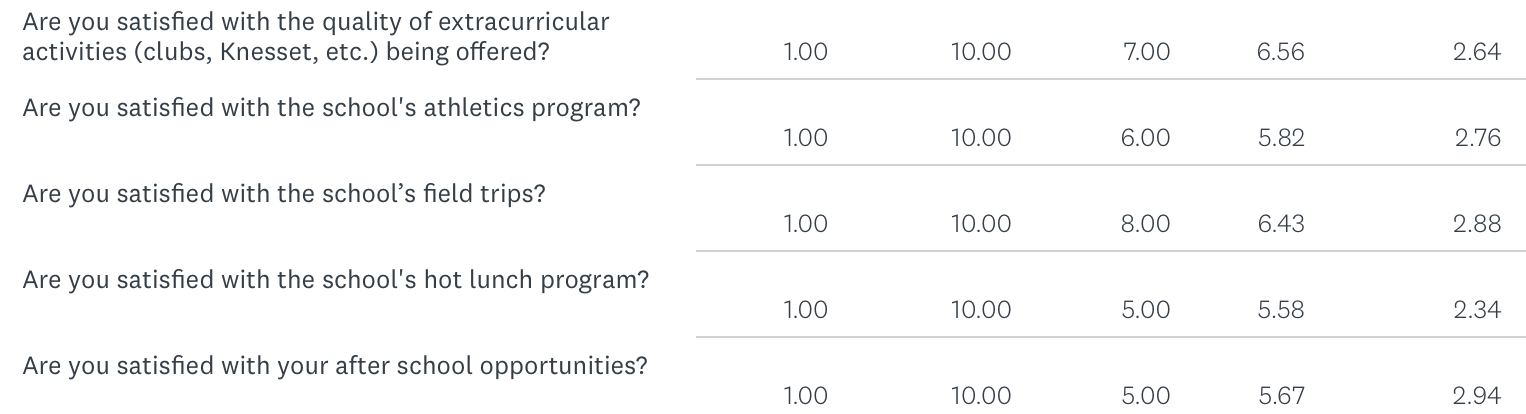
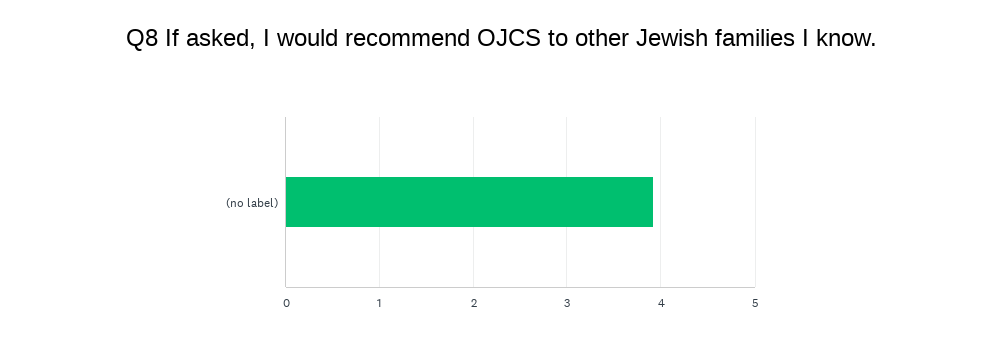
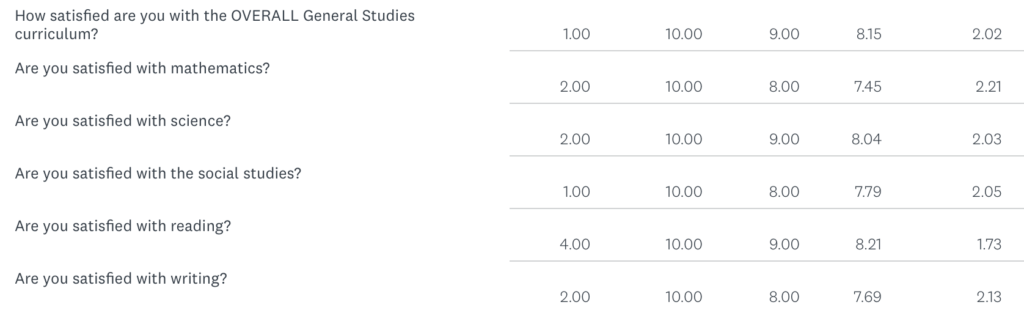
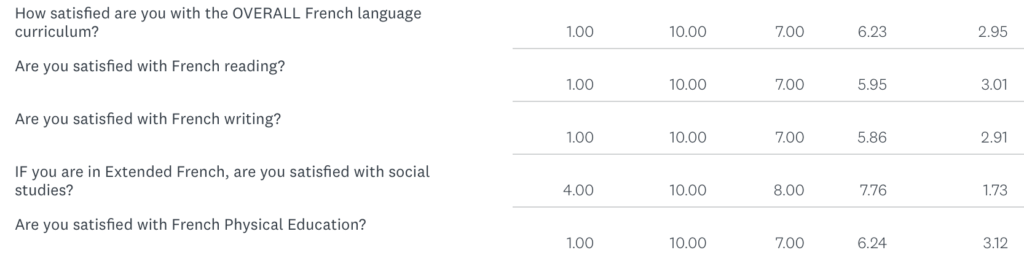
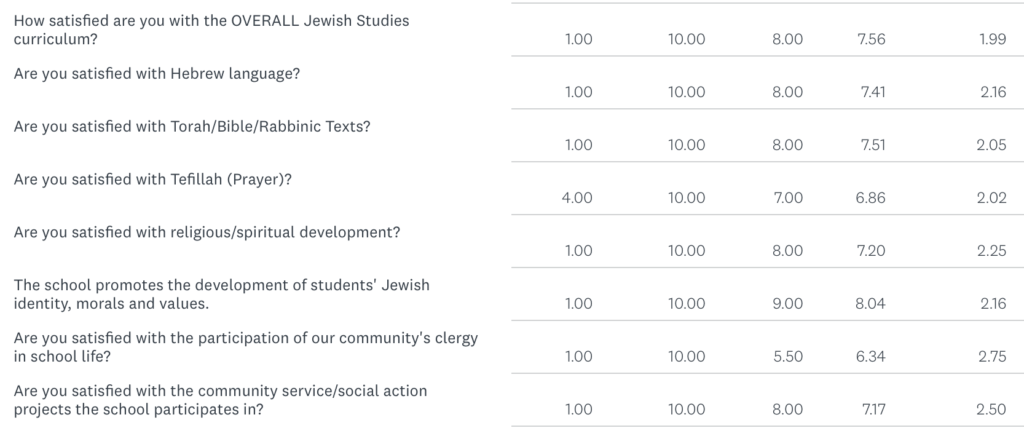
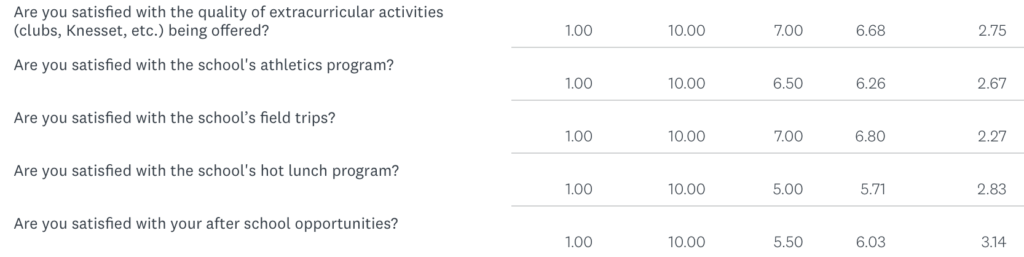
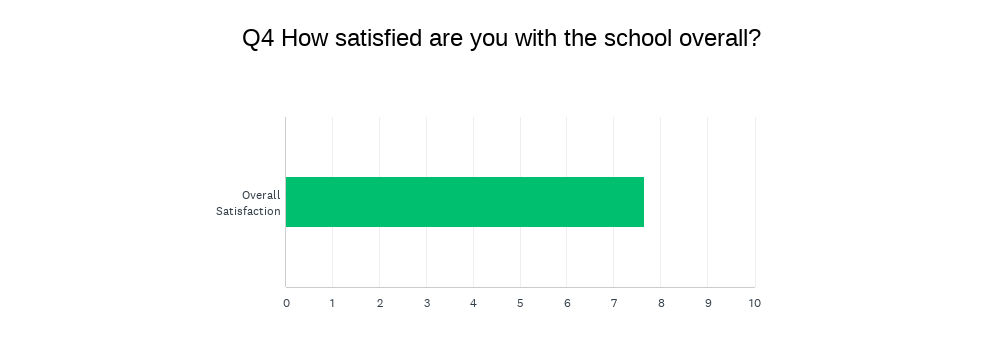 The first chart gives you the breakdown by category; the second chart gives you the weighted average satisfaction score (out of 10). I will remind you that for this and all categories, I look at the range between 7-9 as the healthy band, obviously wanting scores to be closer to 9 than to 7, and looking for scores to go up each year. In terms of “overall satisfaction”, we have now gone from 7.13 to 7.20 to 8.17 to 7.91 to 8.0 to 7.44 to 7.53 to 7.65 Although it continues to tick up over the last two years, the differences are statistically insignificant.


 Without knowing how representative this fifth of students is, this year’s data set is lighter on the “no’s”. Of course the “no’s” are always complicated to unpack because we have no way of knowing who of the “no’s” represent graduation or relocations, as opposed to choosing to attrit prior to Grade 8. However, what continues to be true is that the overwhelming majority of families – regardless of their feedback – stay with us year-after-year. This continues to say a lot about them and a lot about us.
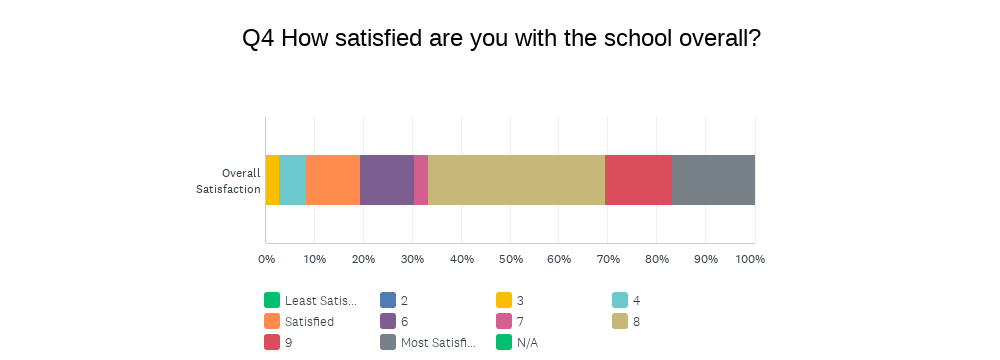
 The first chart gives you the breakdown by category; the second chart gives you the weighted average satisfaction score (out of 10). I will remind you that for this and all categories, I look at the range between 7-9 as the healthy band, obviously wanting scores to be closer to 9 than to 7, and looking for scores to go up each year. In terms of “overall satisfaction”, we have now gone from 7.13 to 7.20 to 8.17 to 7.91 to 8.0 to 7.44 to 7.53. Although it is a tick up from last year, the difference is statistically insignificant.