Welcome to “Part II” of our analysis of this year’s CAT*4 results!
In last week’s post, we provided a lot of background context and shared out the simple results of how we did this year. Here, in our second post, we are now able to begin sharing comparative data, focusing on snapshots of the same cohort (the same children) over time. You may notice a few irregularities in the data because of three factors:
- We did NOT take the CAT*4 in 2020 due to COVID.
- We only took the CAT*4 in Grades 5-8 in 2021.
- We resumed taking the CAT*4 in Grades 3-8 in 2022.
Here is a little analysis that will apply to all five snapshots:
- Remember that any score that is two grades above ending in “.9” represents the max score, like getting a “6.9” for Grade 5.
- Bear in mind, that the metric we are normally looking at when it comes to comparing a cohort over time is whether or not we see at least one full year’s growth (on average) each year – for Grade 8 we are factoring an expected two full year’s growth between 2019 and 2021 due to COVID. [Feel free to refer to prior years’ results for specific analyses of both “COVID Gaps” and “COVID Catch-Ups”.]
- In 2023 we took it in the “.1” of the school year and in all prior years in the “.2”. If we are being technical, therefore, “.9” would actually be the truest measure of growth since the time frame is “.1” less. For the purposes of this analysis, I am going round “.9” up and consider it a “year’s” worth of growth.
Here are the cohort snapshots:
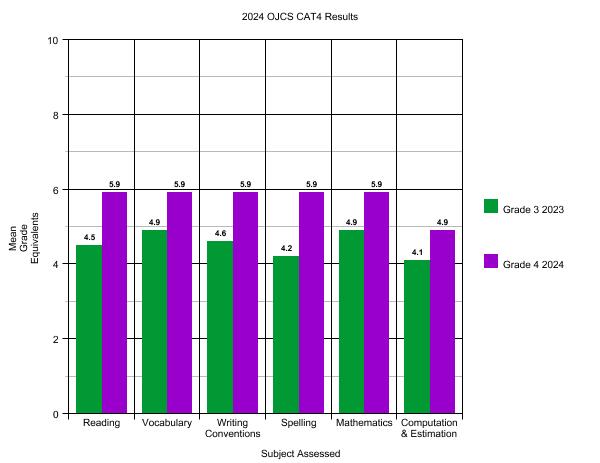
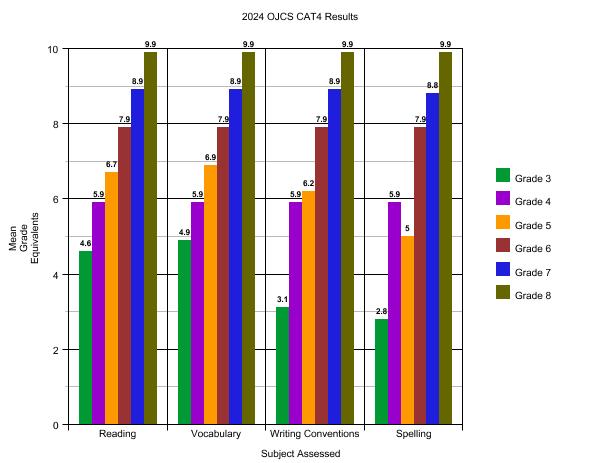
What does this snapshot of current Grade 4s reveal?
- Pretty impressive, eh?! With a maximum score of 5.9s almost all across the board, including more than a year’s growth in some categories, this is about as much as can reasonably expect.
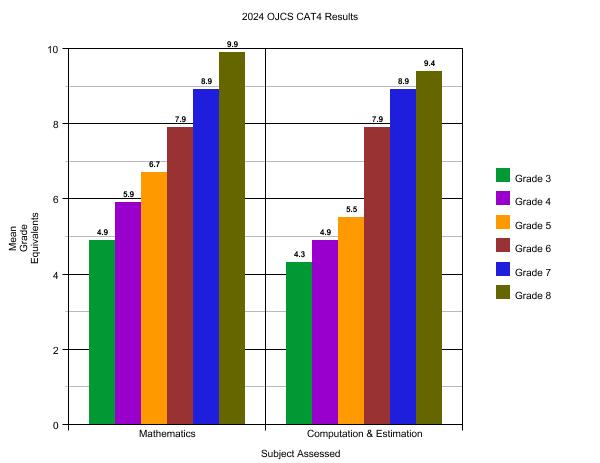
- The only place to pay attention to is Computation & Estimation, which although above grade-level (in both years), “only” showed .8 growth where we prefer to see .9 or higher. But that is a very minor difference.
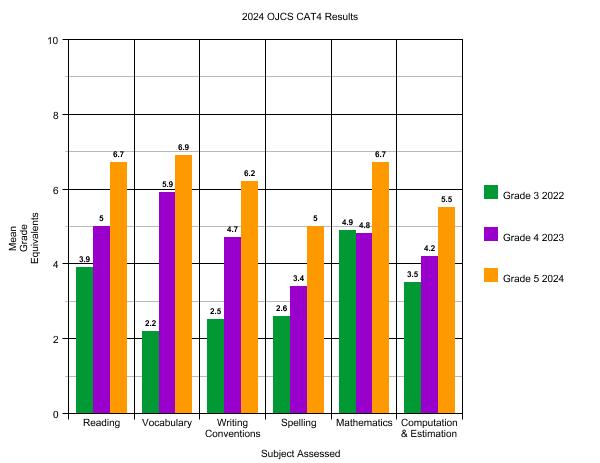
What does this snapshot of current 5s reveal?
- Again, incredibly impressive all across the board, with lots of places where we see way more than 1 year’s worth of growth!
- Important context in the places that in the 2024 results look lower. Spelling, which just fell below the baseline of 5.1, actually grew at a 1.6. Computation & Estimation actually grew at a 1.3. This means that both are on track with another year to be on par with the rest of new-max scores.
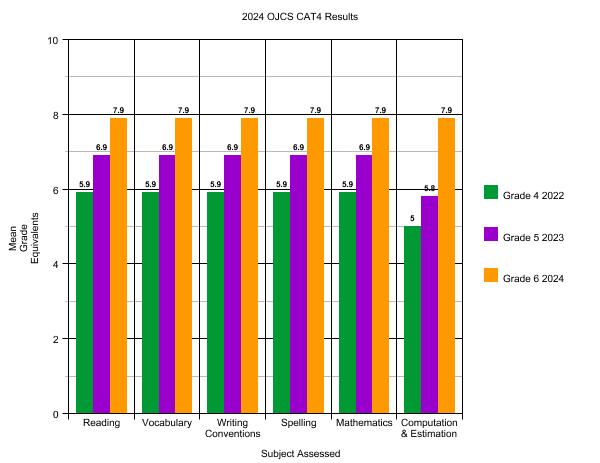
What does this snapshot of current 6s reveal?
I mean…nothing really to say at all. Perfect max scores all across the board with Computation & Estimation making the final leap up to join the rest. Wow.
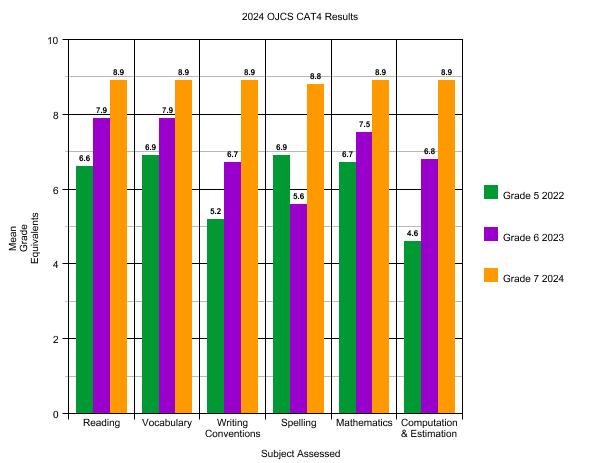
What does this snapshot of current 7s reveal?
- Again, incredibly impressive, not only the near-perfects across the board, but the growth in some areas is above and beyond.
- Writing Conventions took a 1.3 leap to the top.
- Spelling took a huge 3.2 leap to the near-top.
- Both Math scores took huge leaps as well.
All of this shows the cumulative effect of our Middle School.
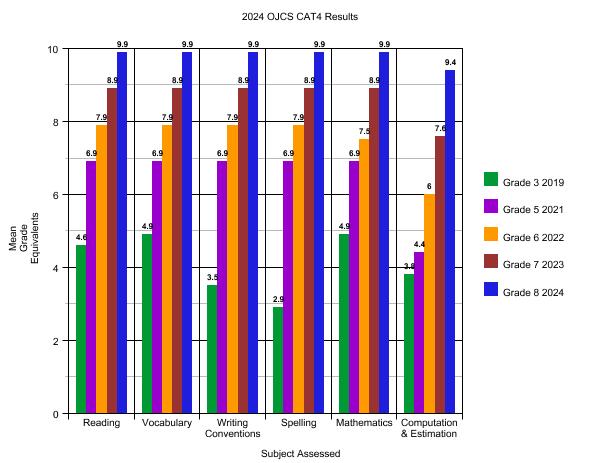
What does this snapshot of current 8s reveal?
No analysis of current Grade 8s needed, just appreciation for their tremendous growth across their careers at OJCS and for their last three years of near perfection. Not a bad advertisement for OJCS and the OJCS Middle School.

To sum up this post, we have so much to be proud of in the standardized test scores of these particular cohorts over time. The Math and Language Arts Teachers in Grades 3-8 have now begun meeting to go through their CAT*4 results in greater detail, with an eye towards what kinds of interventions are needed now – in this year – to fill any gaps (both for individual students and for cohorts); and how might we adapt our long-term planning to ensure we are best meeting needs. Parents will be receiving their child(ren)’s score(s) soon as they, and any contextualizing conversations, will be folded into Parent-Teacher Conferences.
Stay tuned next week for the concluding “Part III” when we will look at the same grade (different students) over time, see what additional wisdom is to be gleaned from that slice of analysis, and conclude this series of posts with some final summarizing thoughts.


 As the eve of a new Jewish Year approaches, it is my most sincerest hope that this is the year we’ve been waiting for. To all the teachers, staff, parents, students, donors, supporters, and friends in this special school- thank you for your enthusiasm and your hard work. 5785 is shaping up to be a quite an amazing year!


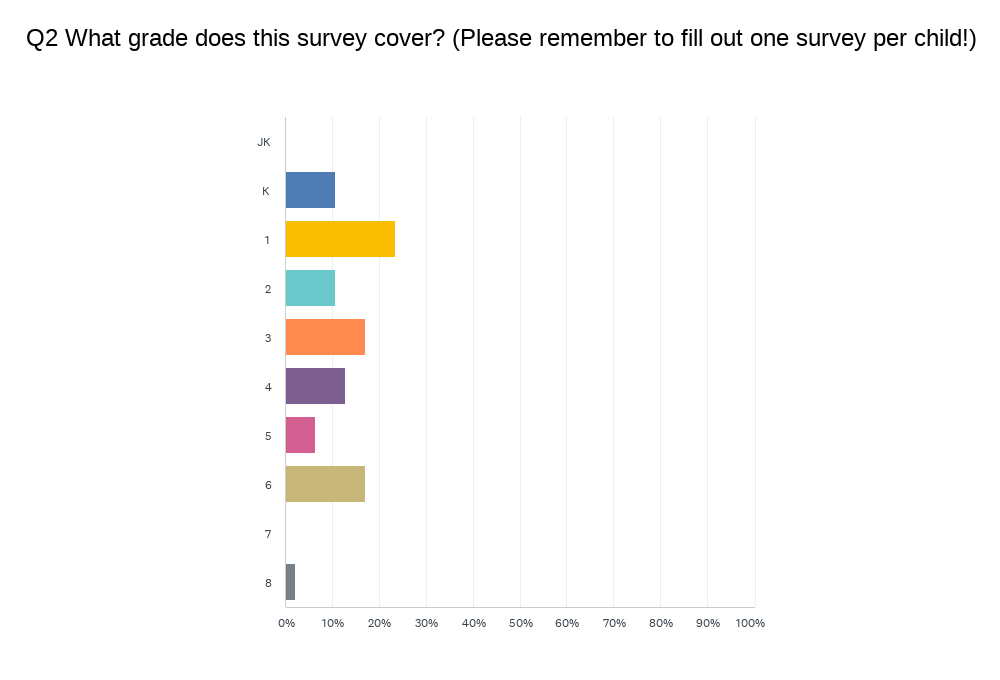
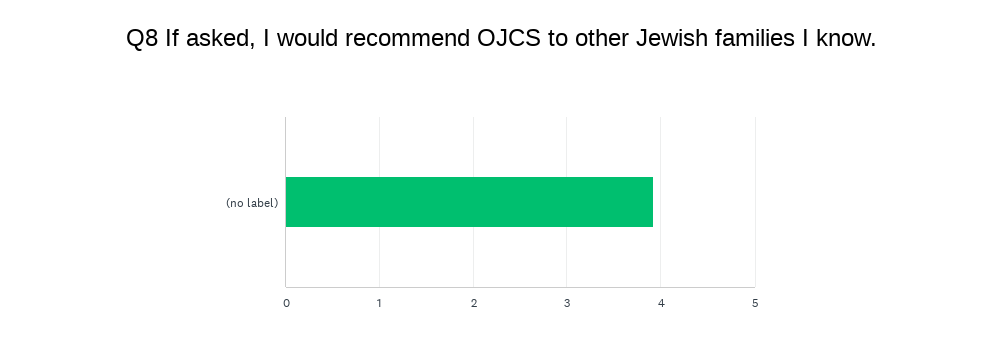
 Without knowing how representative this fifth of students is, this year’s data set is lighter on the “no’s”. Of course the “no’s” are always complicated to unpack because we have no way of knowing who of the “no’s” represent graduation or relocations, as opposed to choosing to attrit prior to Grade 8. However, what continues to be true is that the overwhelming majority of families – regardless of their feedback – stay with us year-after-year. This continues to say a lot about them and a lot about us.
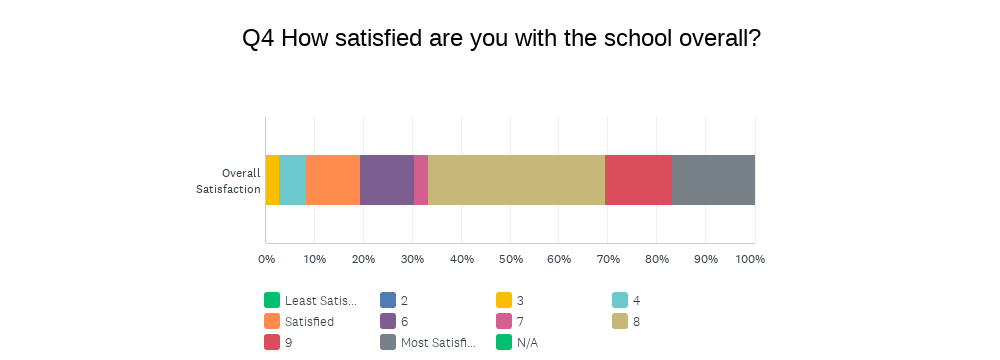
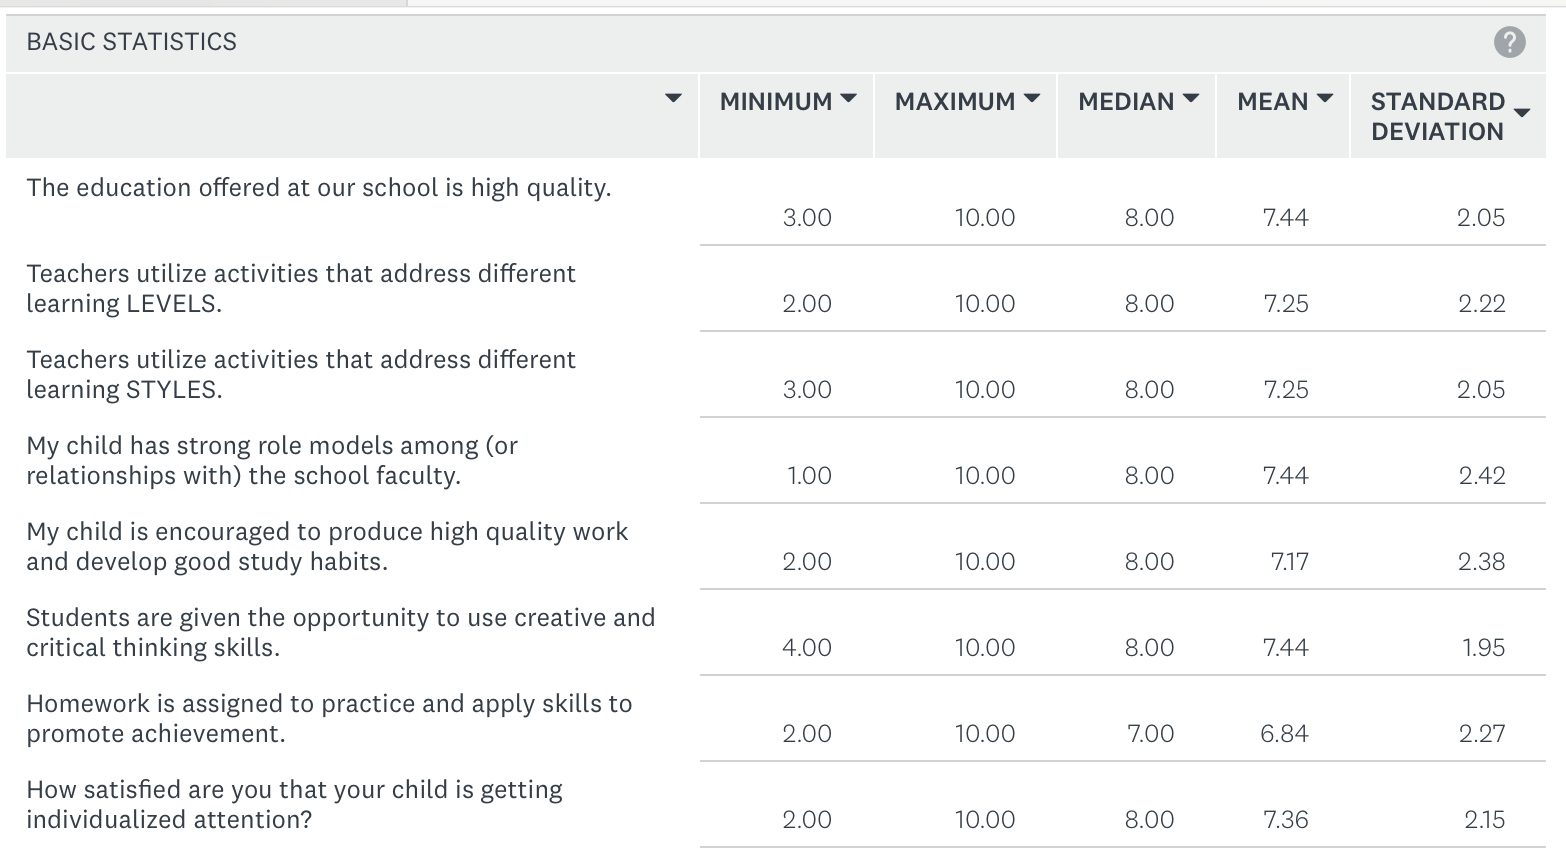
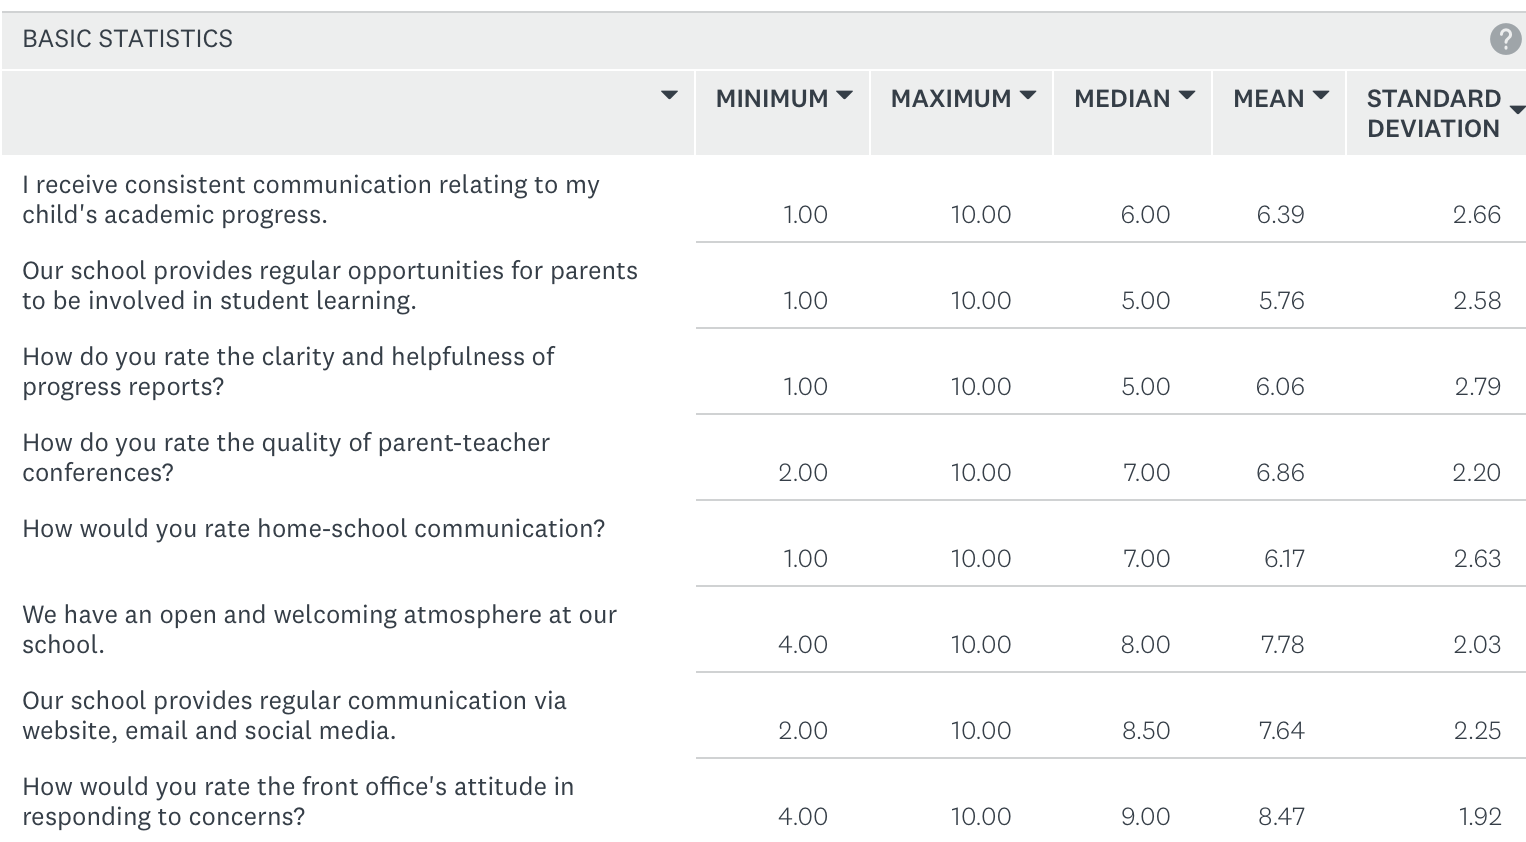
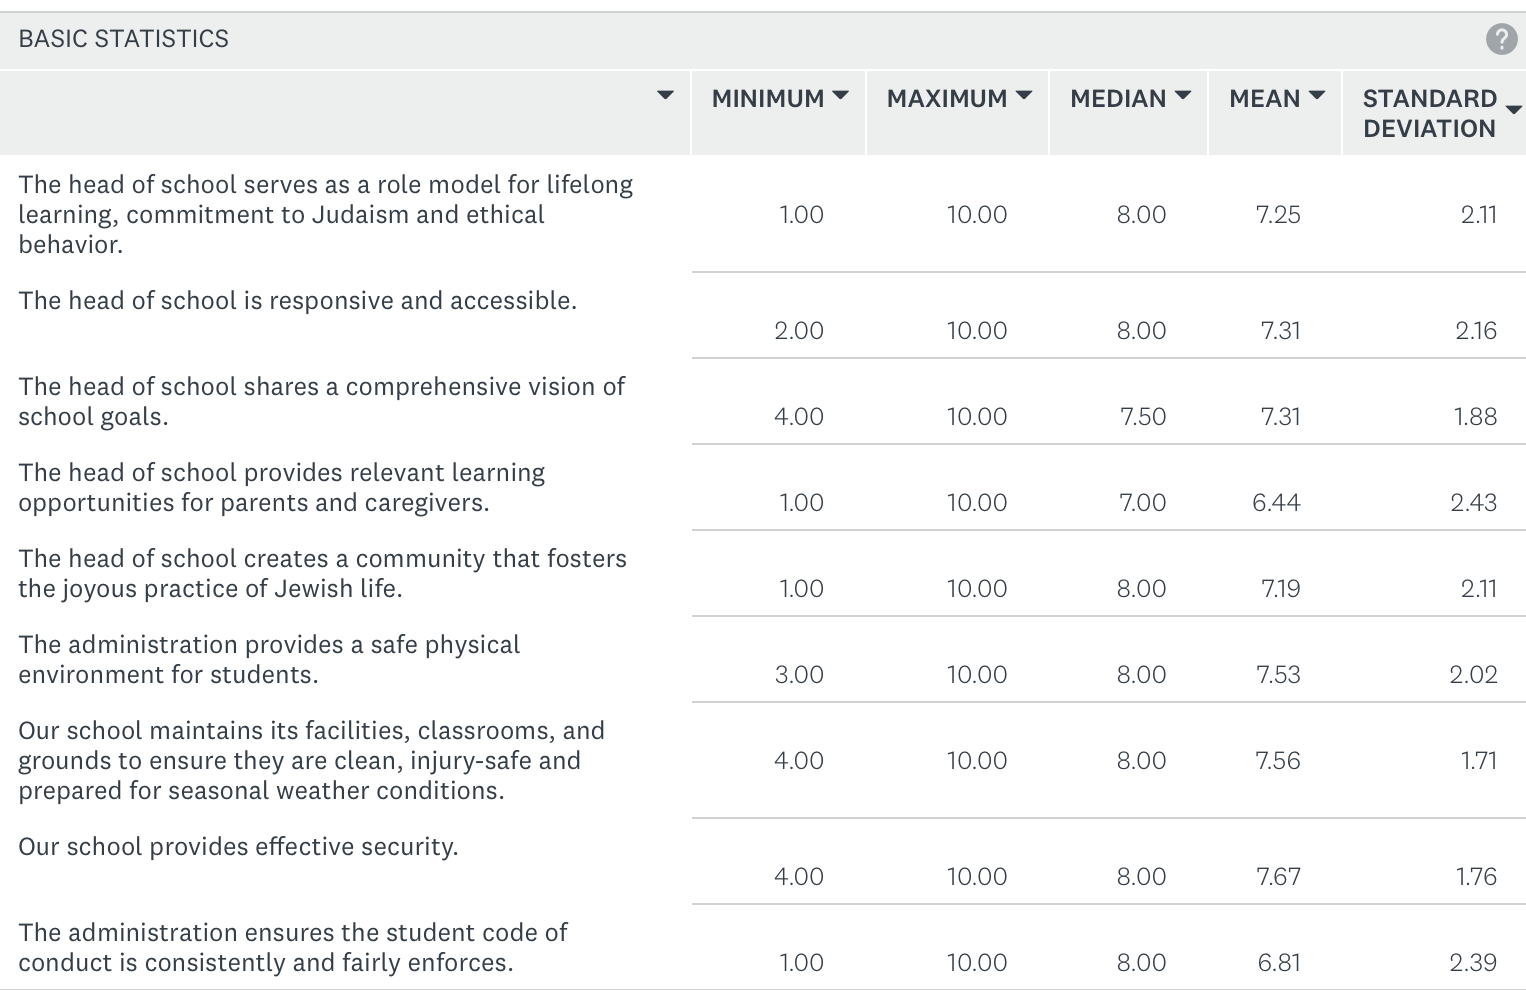
 The first chart gives you the breakdown by category; the second chart gives you the weighted average satisfaction score (out of 10). I will remind you that for this and all categories, I look at the range between 7-9 as the healthy band, obviously wanting scores to be closer to 9 than to 7, and looking for scores to go up each year. In terms of “overall satisfaction”, we have now gone from 7.13 to 7.20 to 8.17 to 7.91 to 8.0 to 7.44 to 7.53. Although it is a tick up from last year, the difference is statistically insignificant.